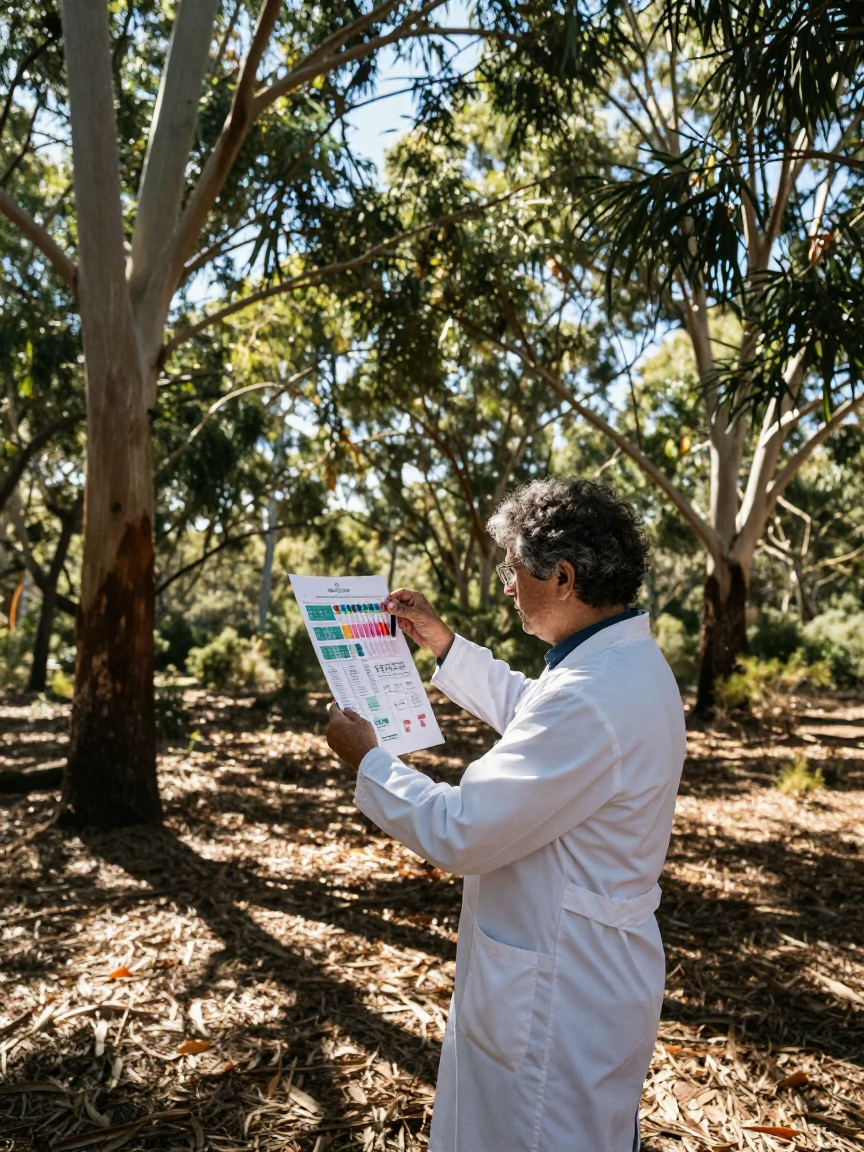
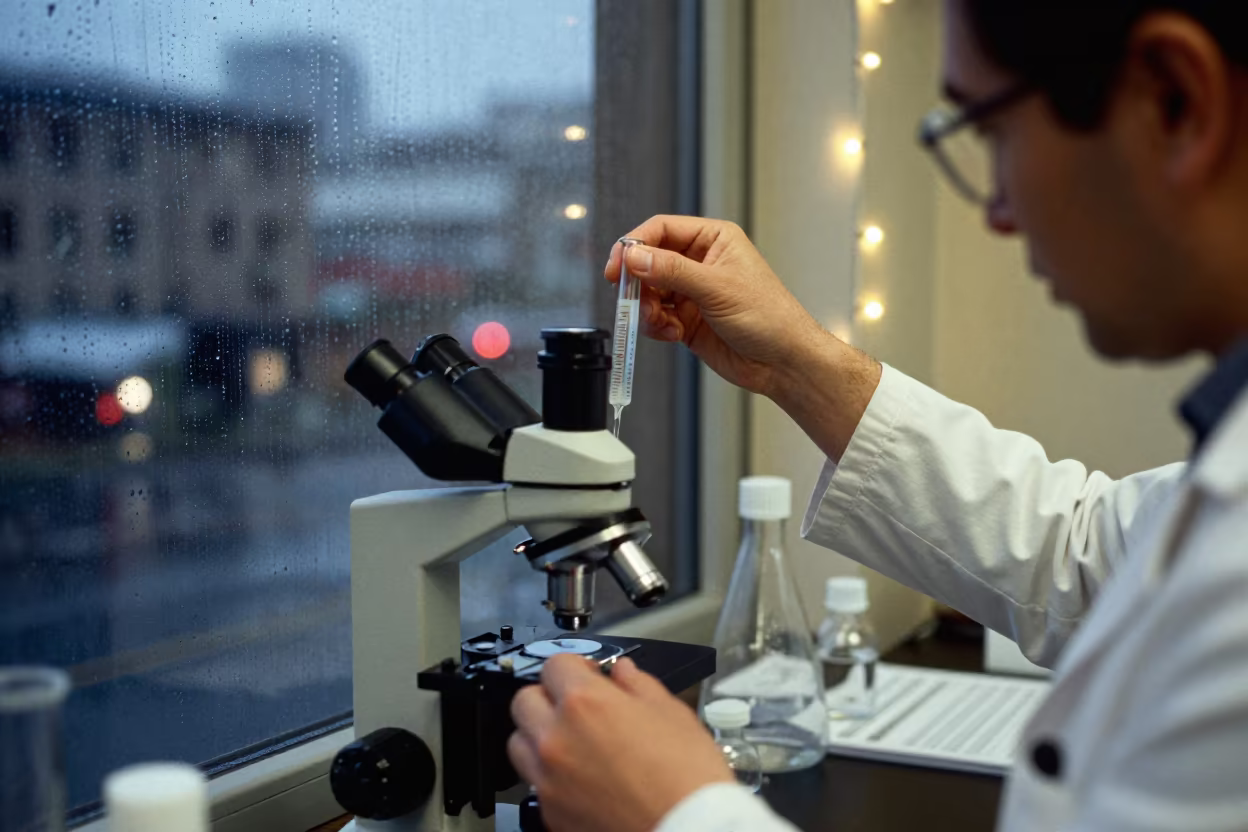
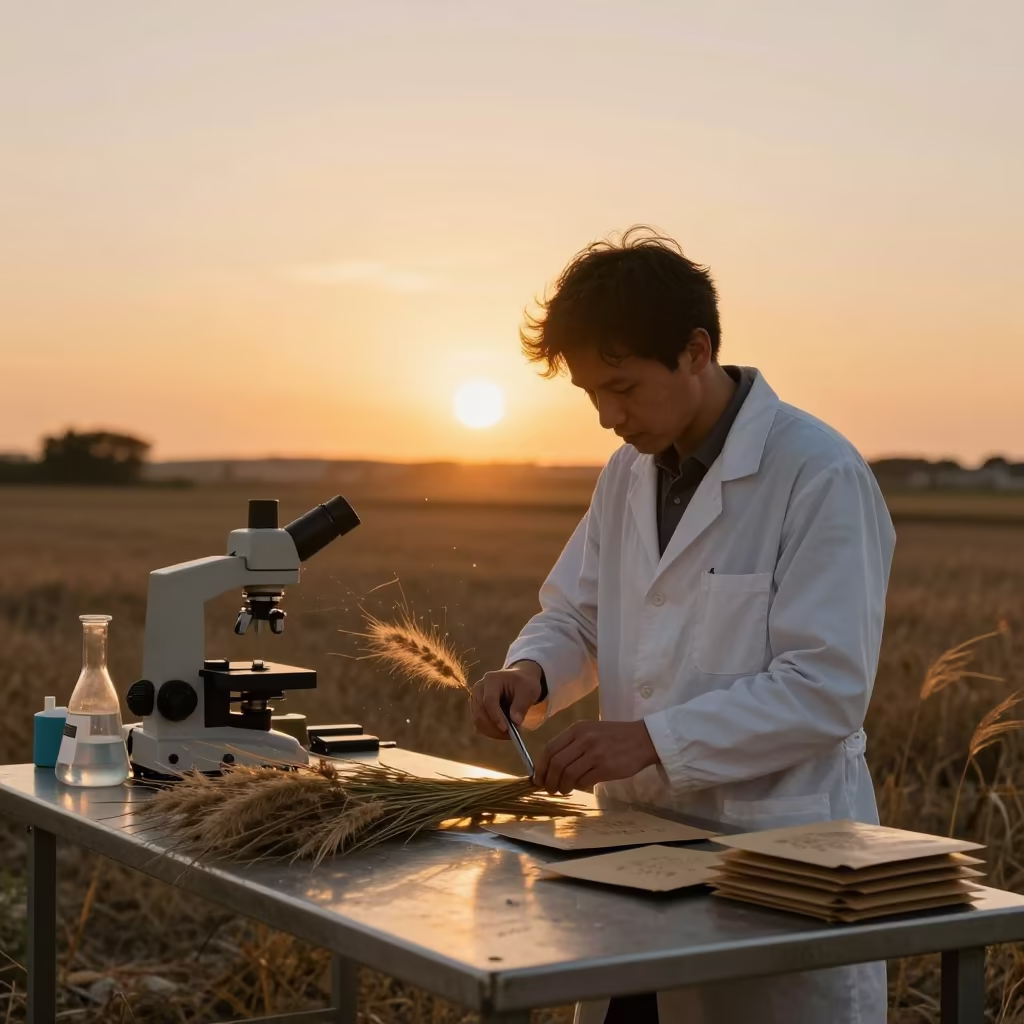
Scientist matching sample tubes to field chart
Dappled sunlight falls through green leaves, creating shifting patches of bright yellow and deep shadow across a white table. A scientist in a white lab coat stands beside the table, holding two small glass vials filled with amber and green liquids. Their hands hover over a laminated field chart, comparing the liquid colors against printed swatches. The chart displays rows of color codes and alphanumeric data. Behind the subject, a blurred background of eucalyptus trees suggests a research station in Perth. Late summer heat hangs heavy in the humid air, visible as a slight haze around the foliage. The scientist's posture is rigid and focused, eyes locked on the comparison. A drop of water beads on the edge of the chart, catching a shard of light.
Free to download. CDN hosting requires a link back to this page. Terms
Similar Images
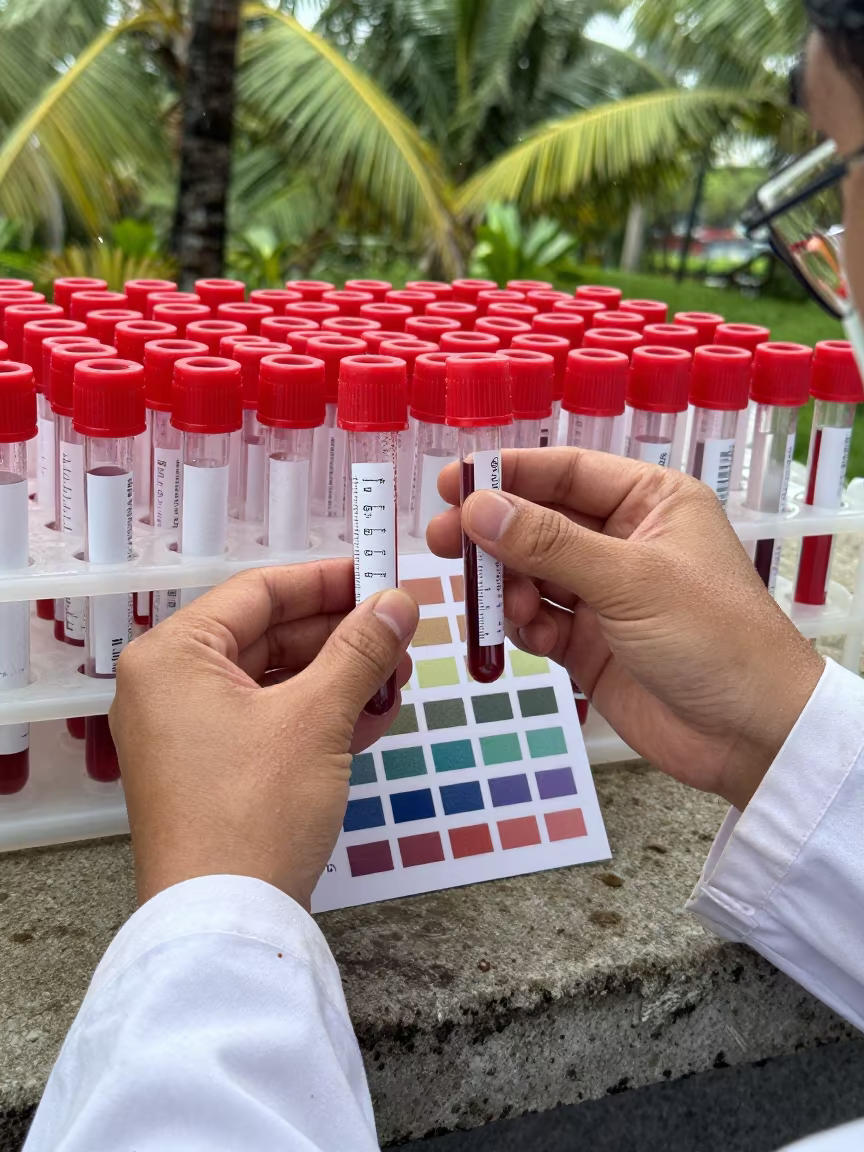
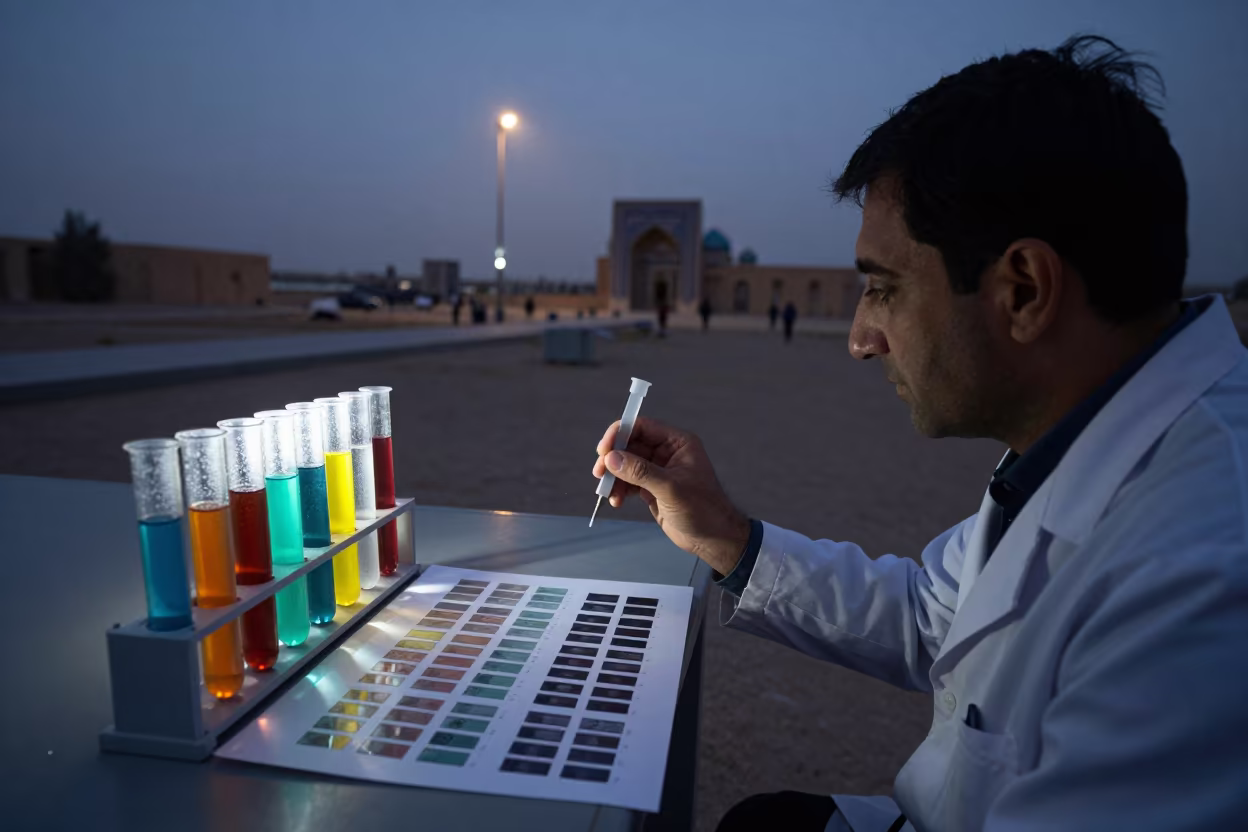
Monsoon Scientist Matching Tube Colors Chart
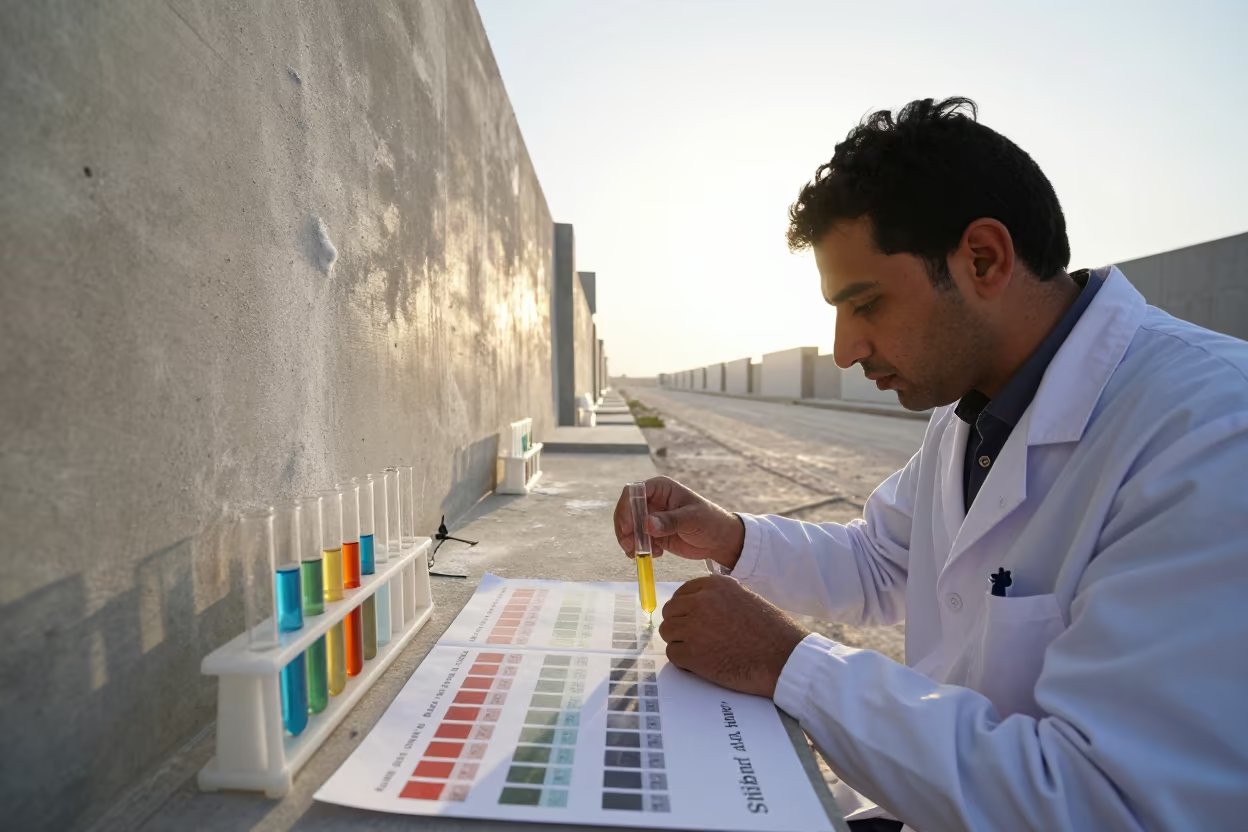
Scientist Matches Sample Colors in Shibin Al Kawm
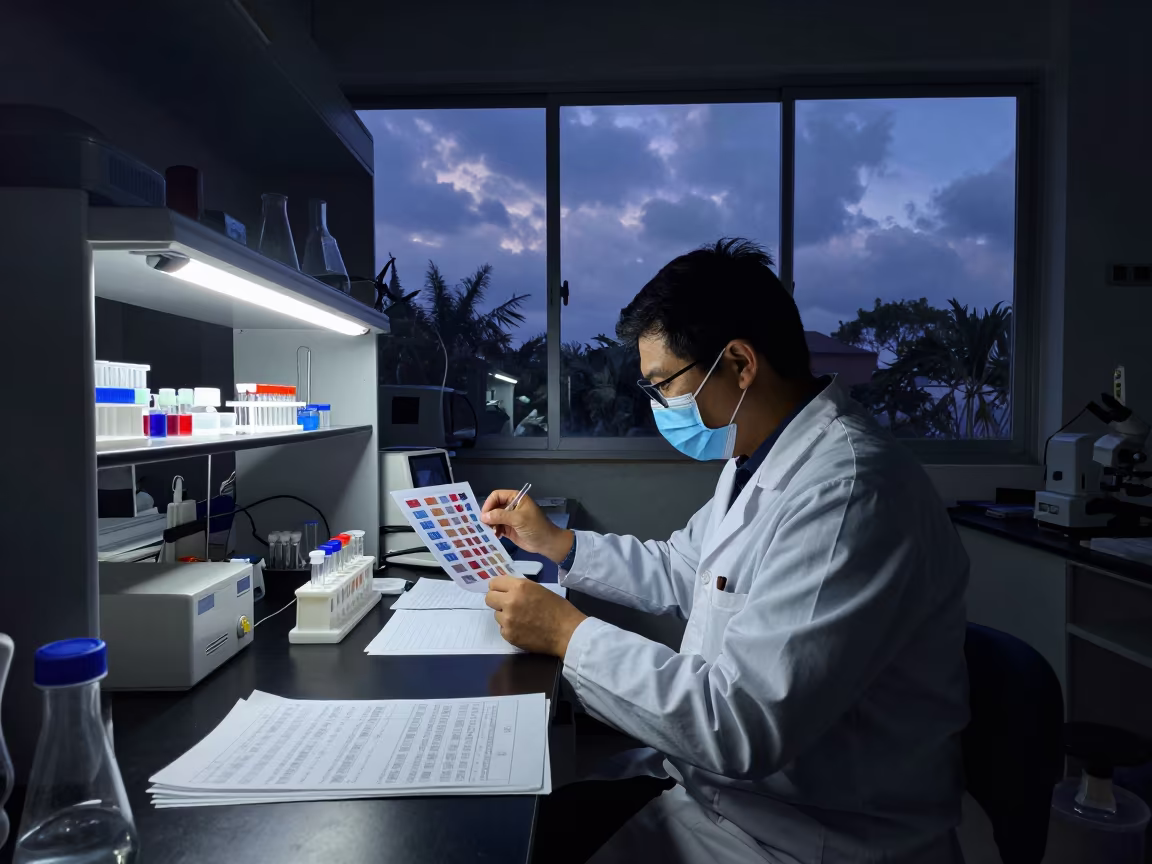
Scientist Matches Sample Tubes to Chart Under Neon Light
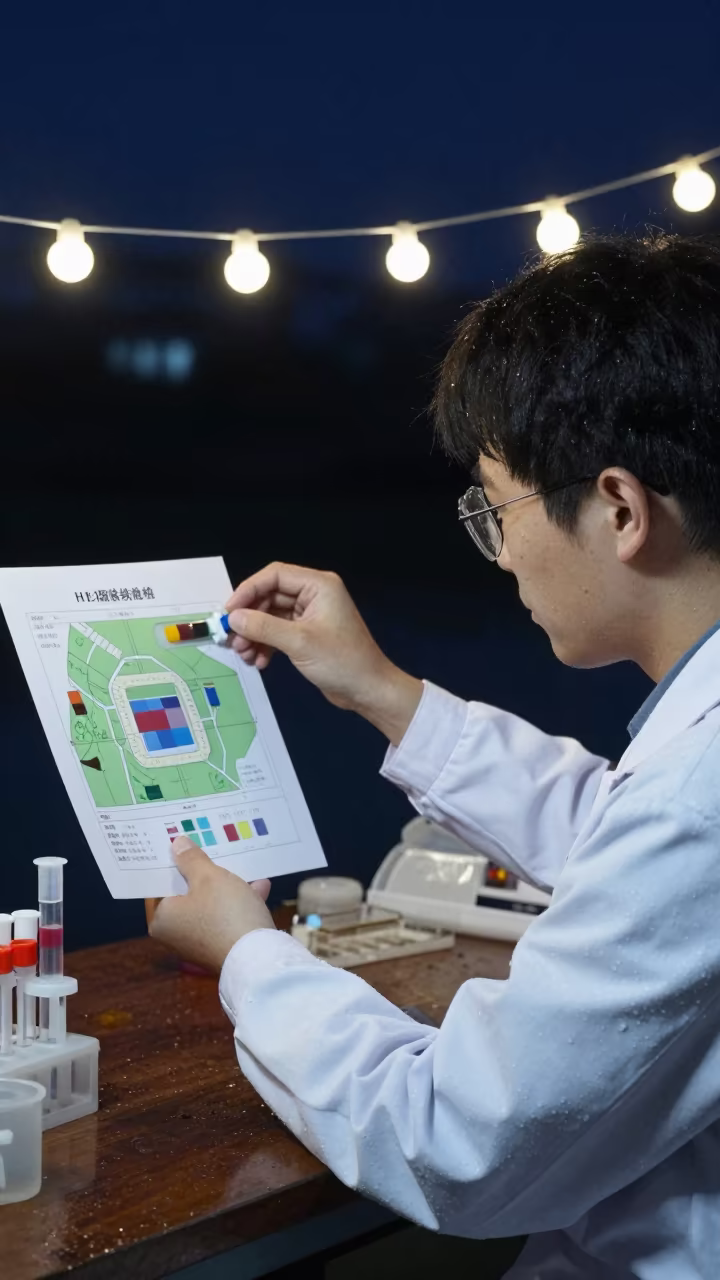
Night Scientist Matching Tube Colors Chart Haikou
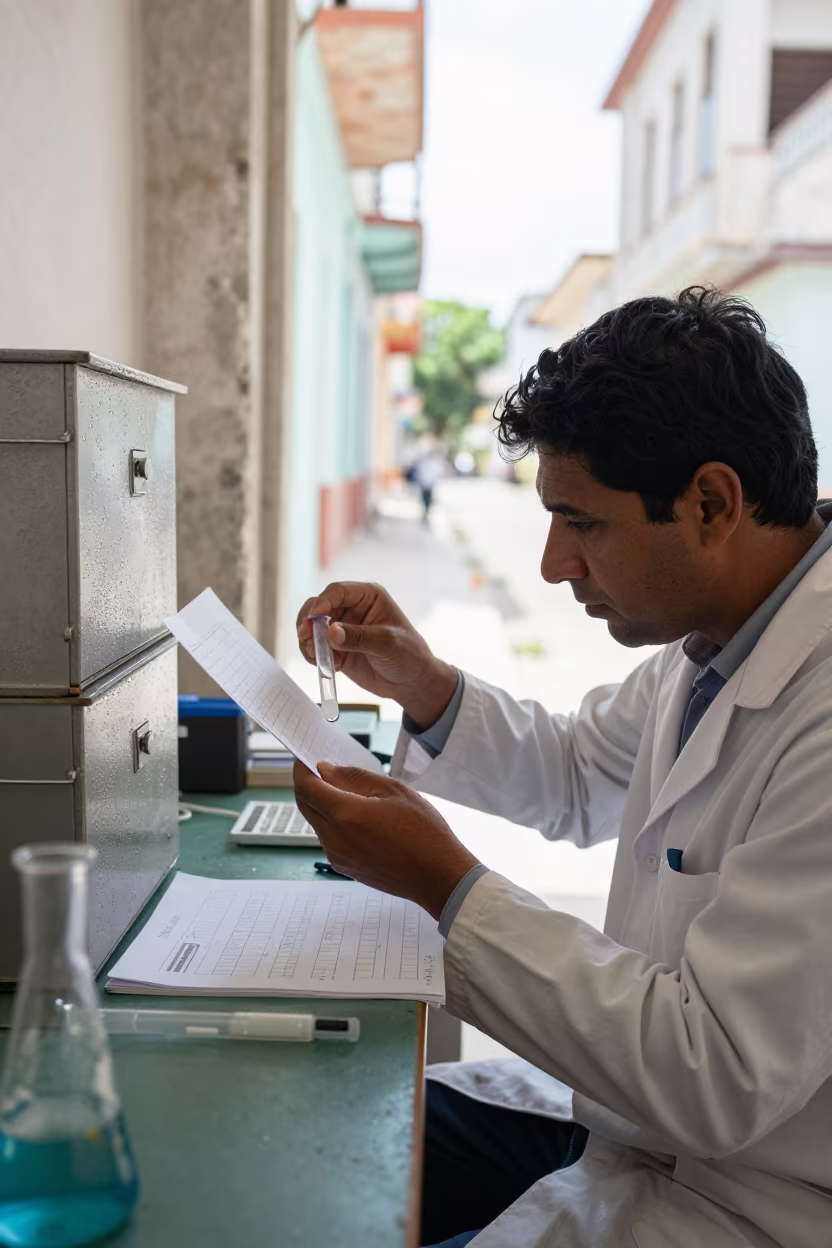
Scientist Matching Samples in Dry Cuban Light
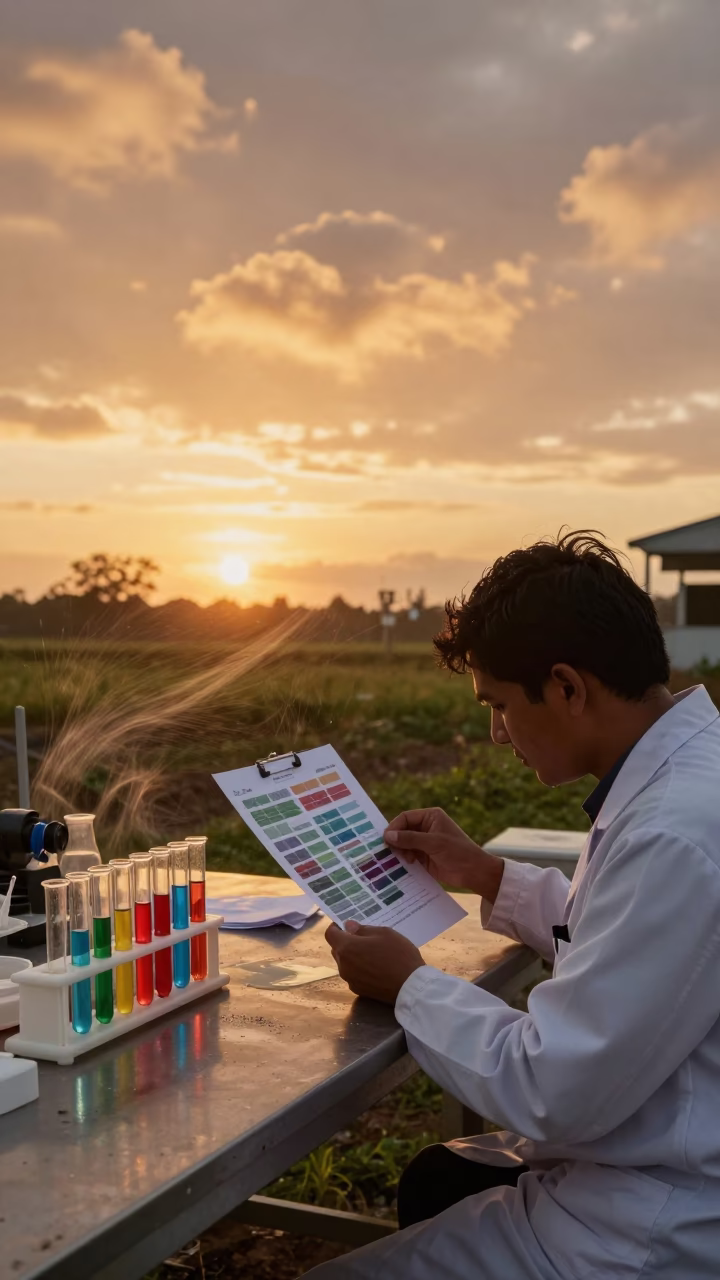
Amber Light Over Sample Tubes in Bago
Scientist Matches Sample Tubes to Field Chart
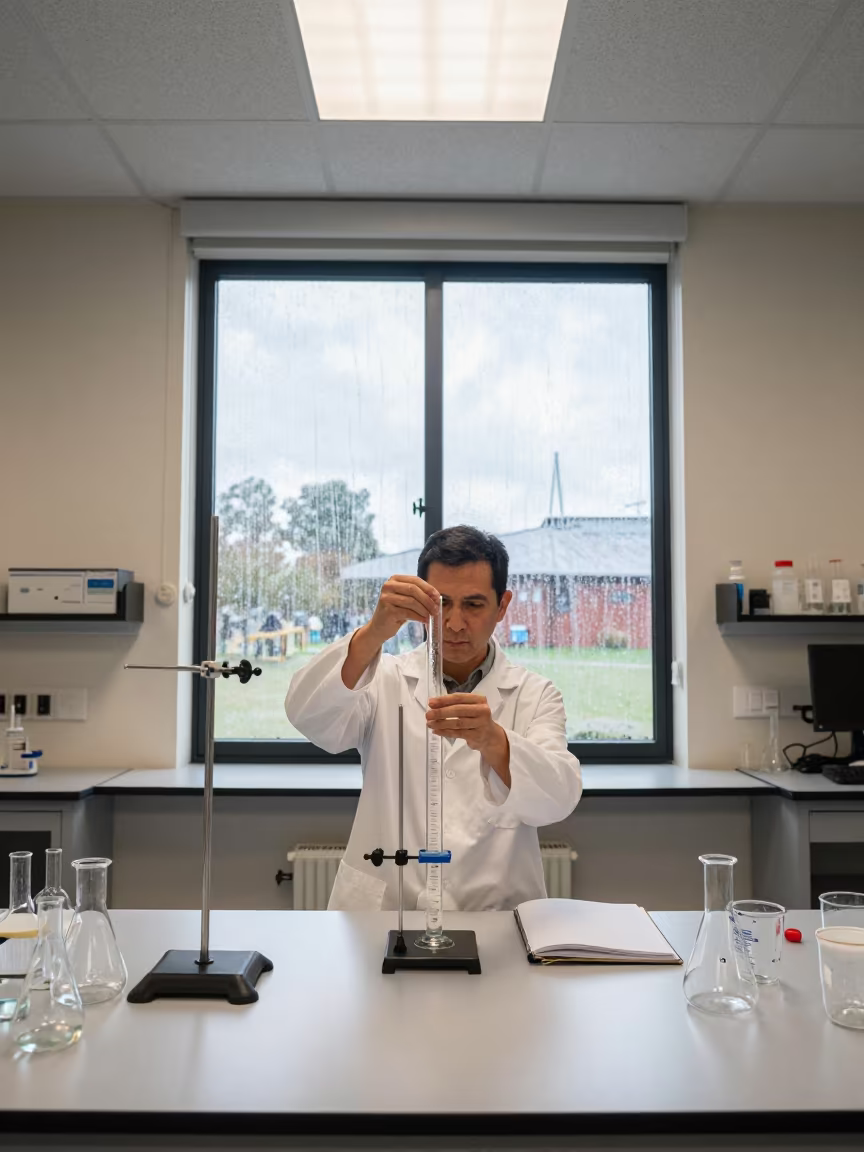
Chemist Adjusts Burette in Melbourne Lab
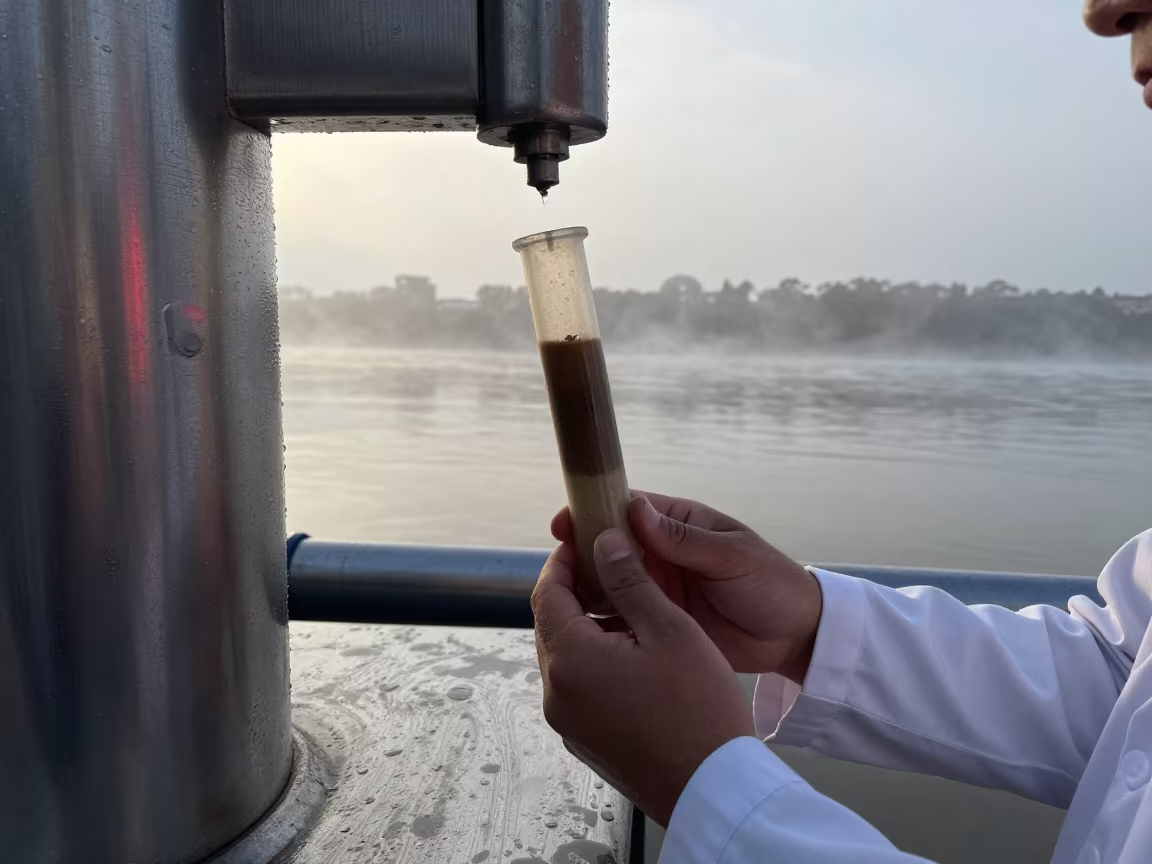
Scientist Holding Sediment Core Dawn Light
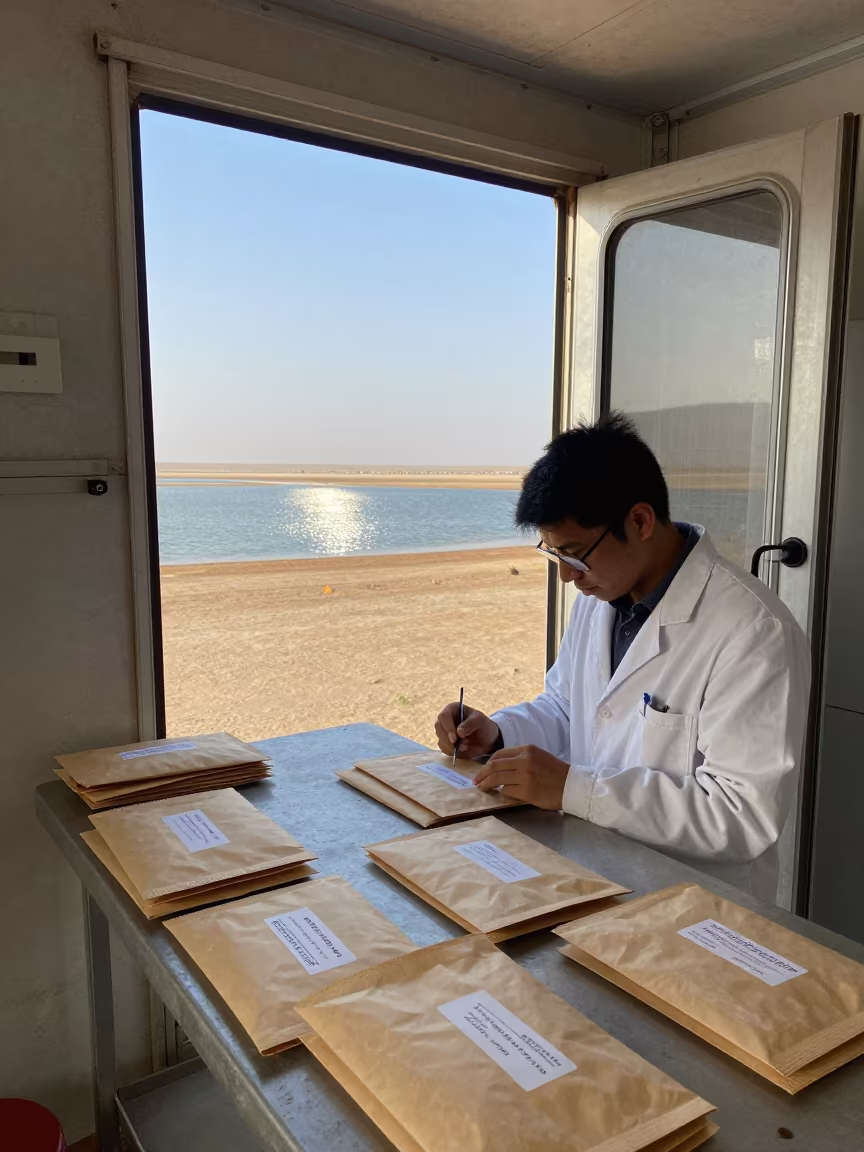
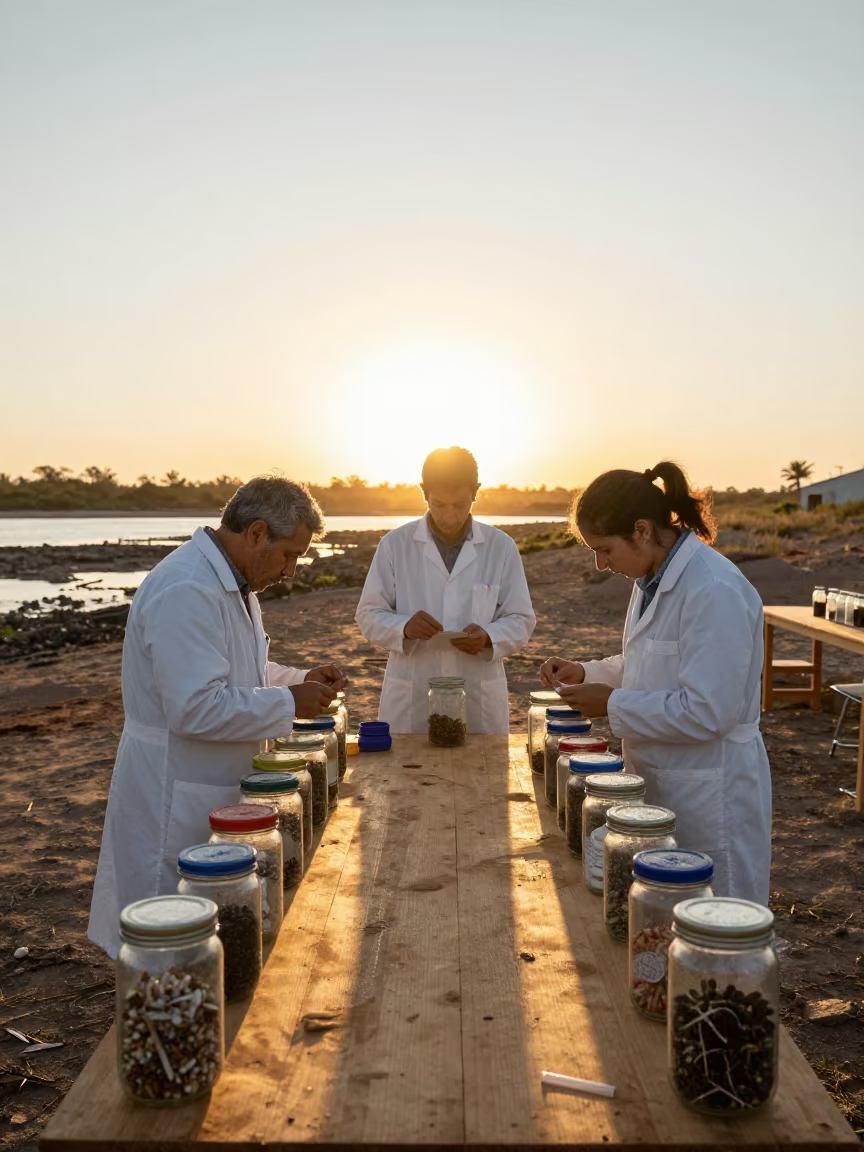
Scientist Labeling Specimens in Desert Trailer
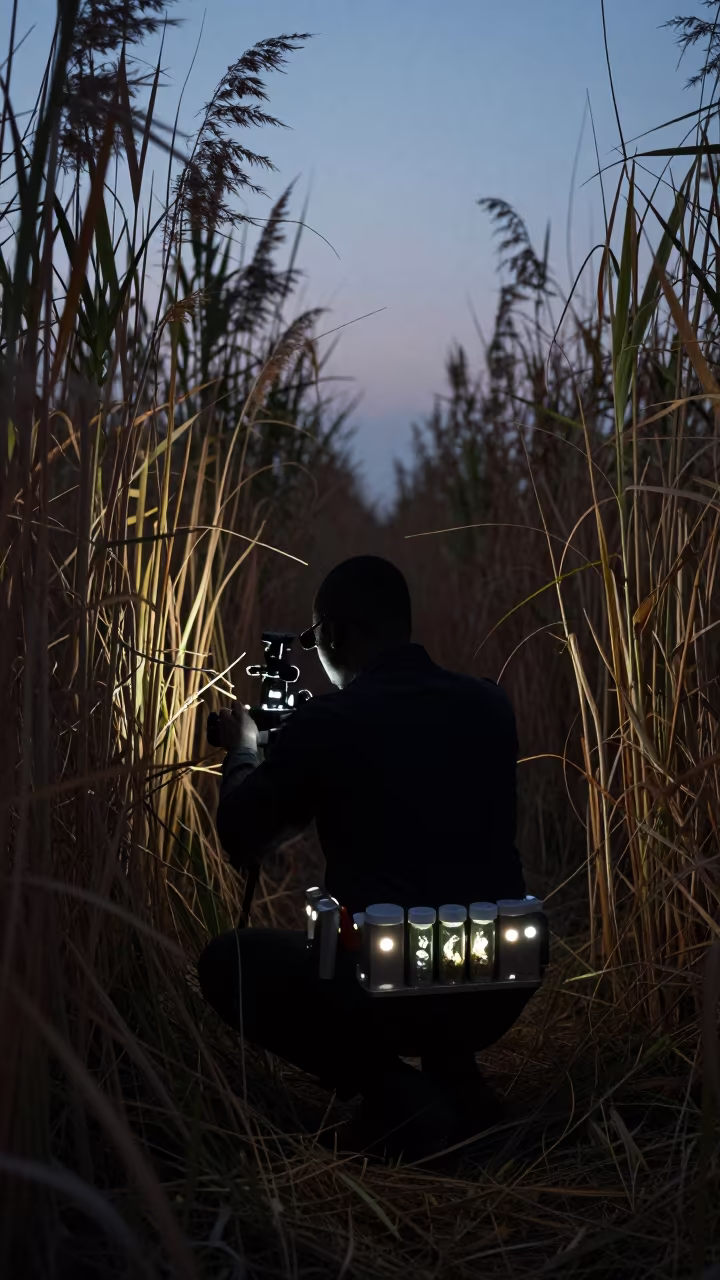
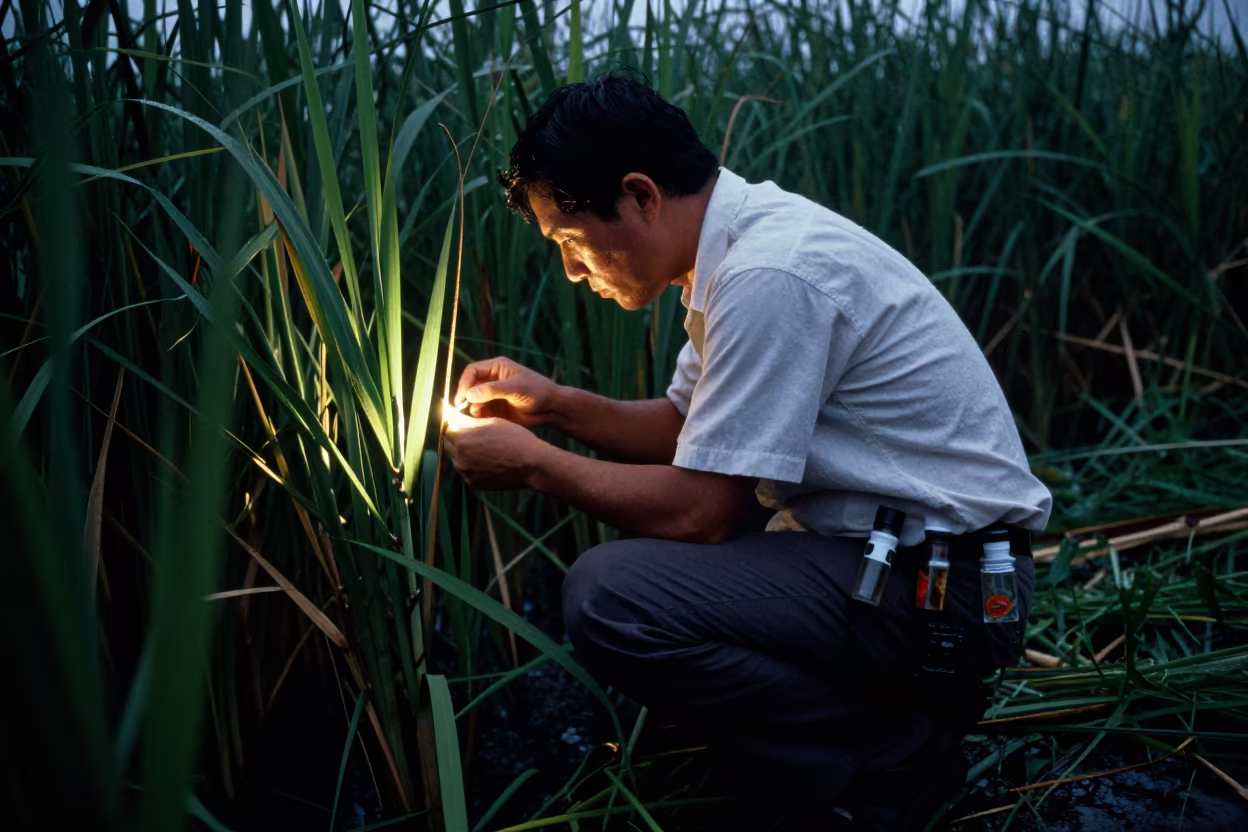
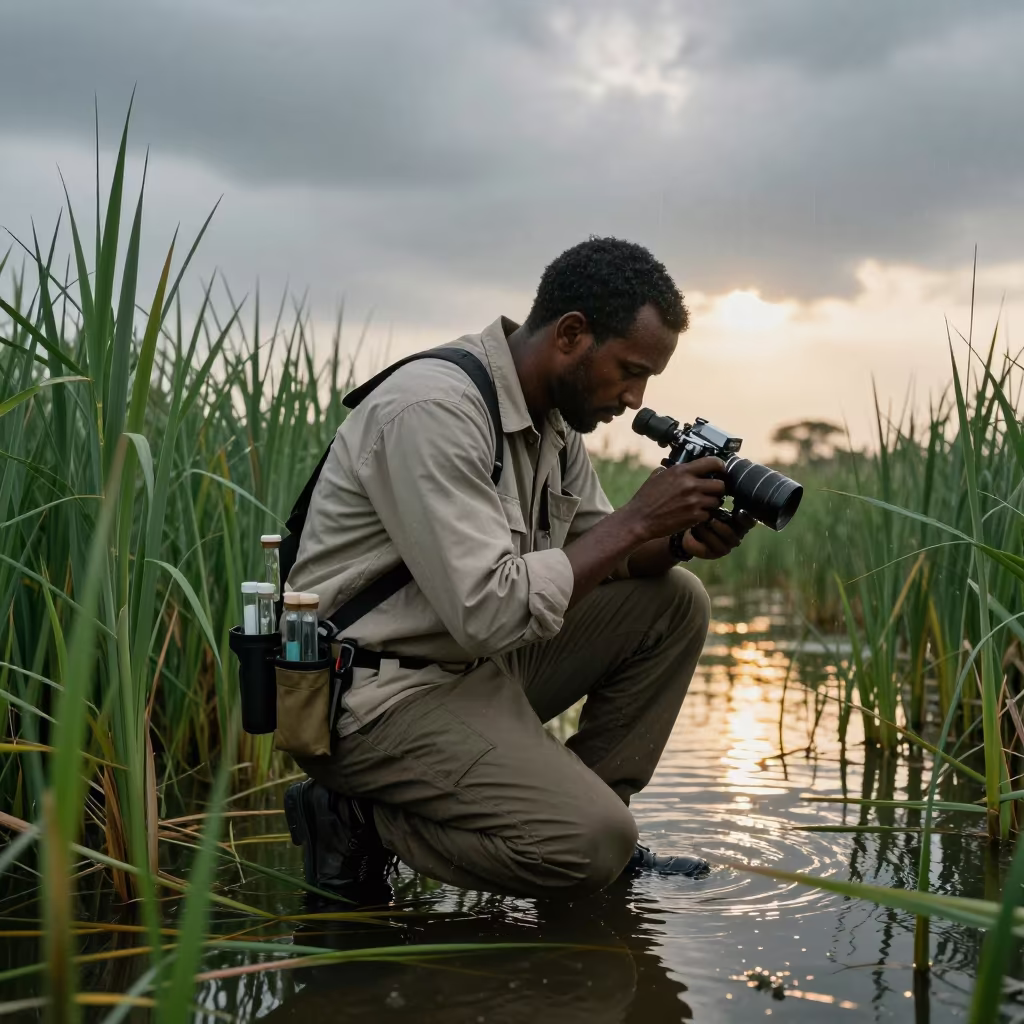
Biologist Silhouette in Abuja Reeds at Twilight
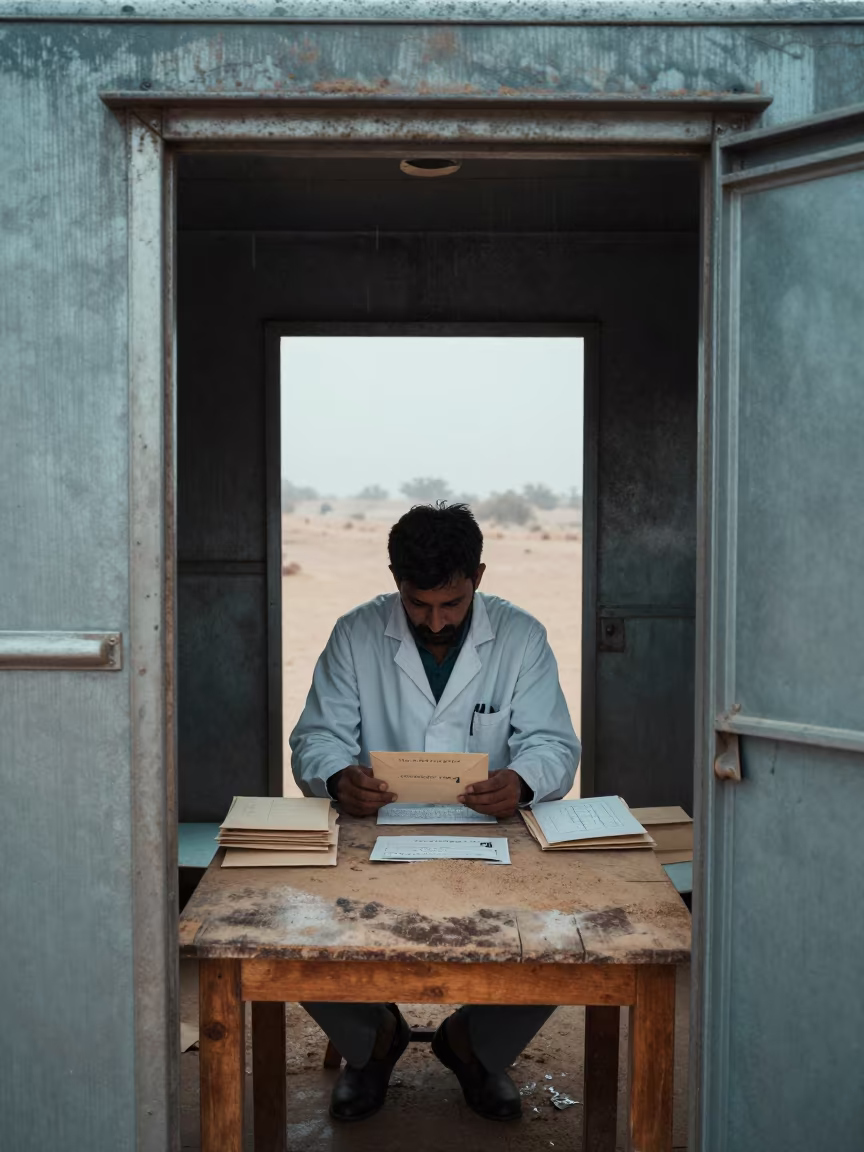
Desert Scientist Labeling Specimens After Rain
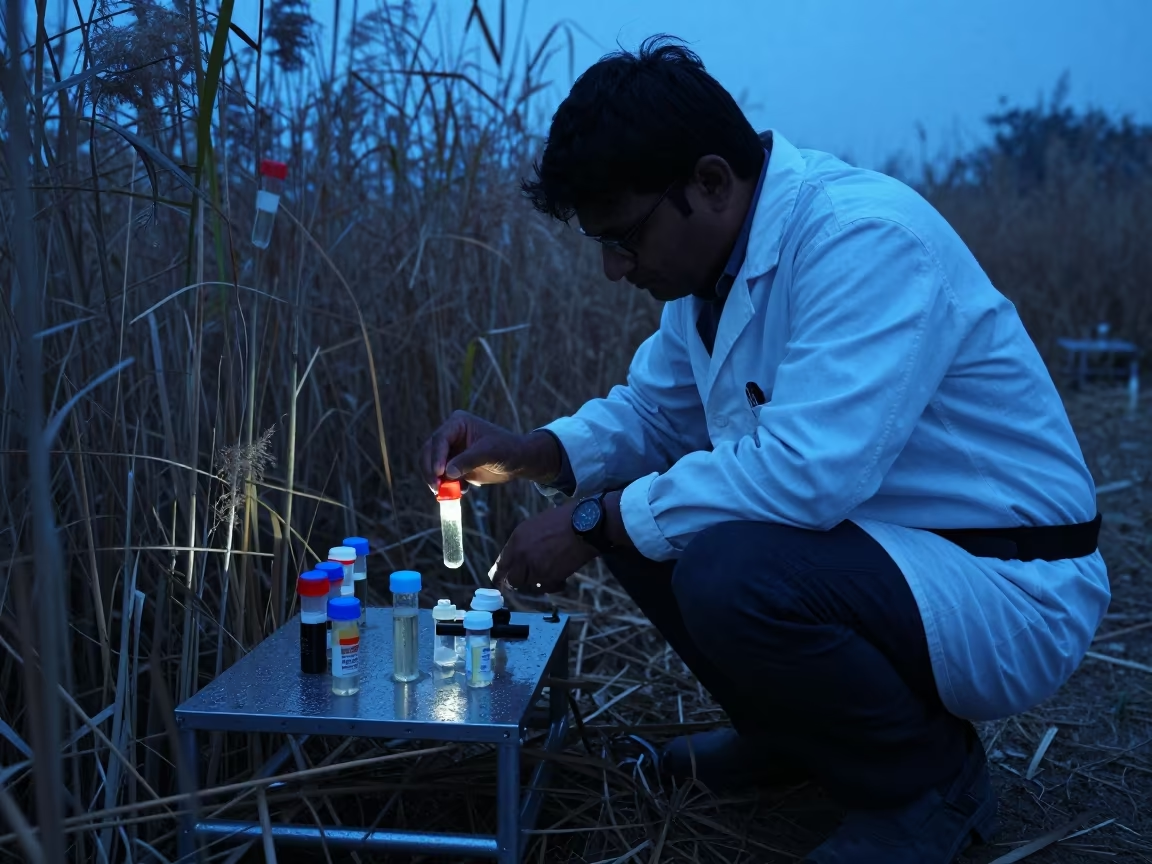
Biologist in Ahmedabad Reeds with Specimen Vials
Biologist in Montreal Reeds at Sunset
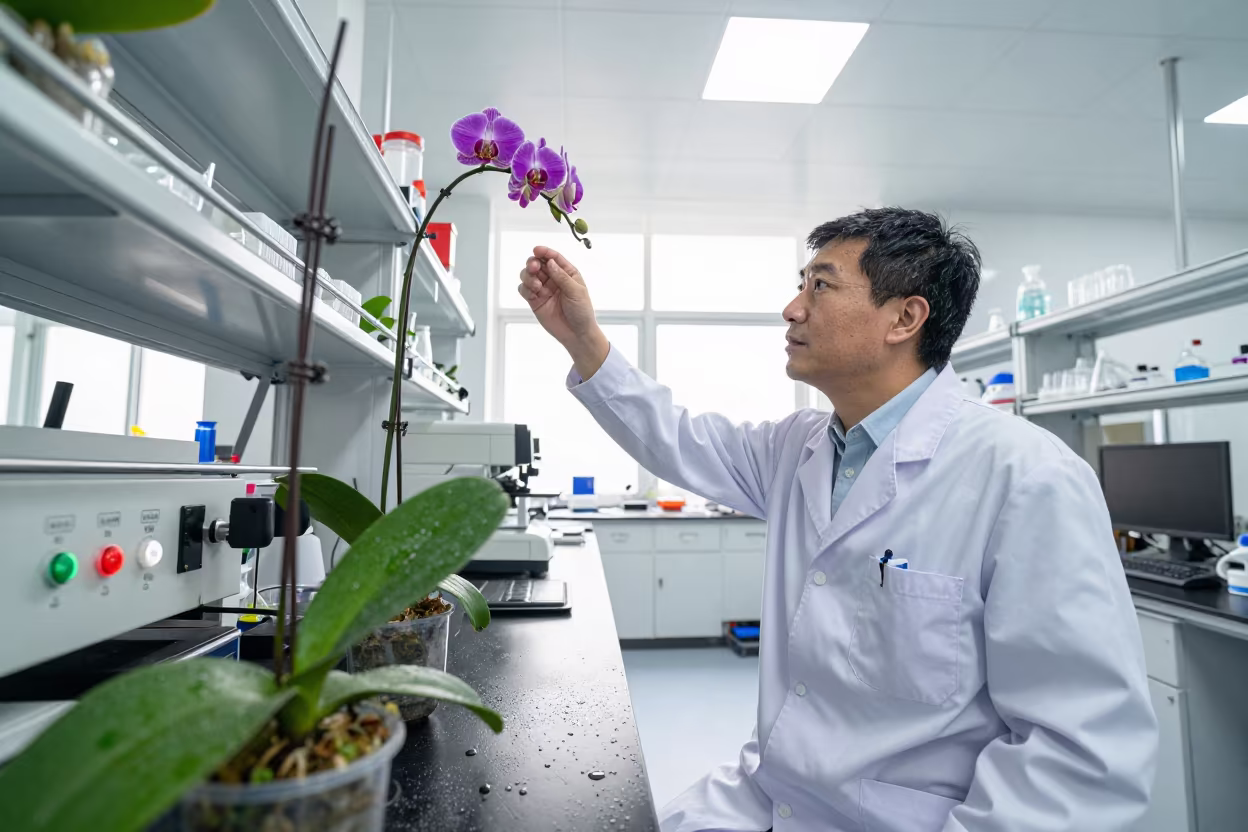
Botanist Reaching for Orchids in Lab Light
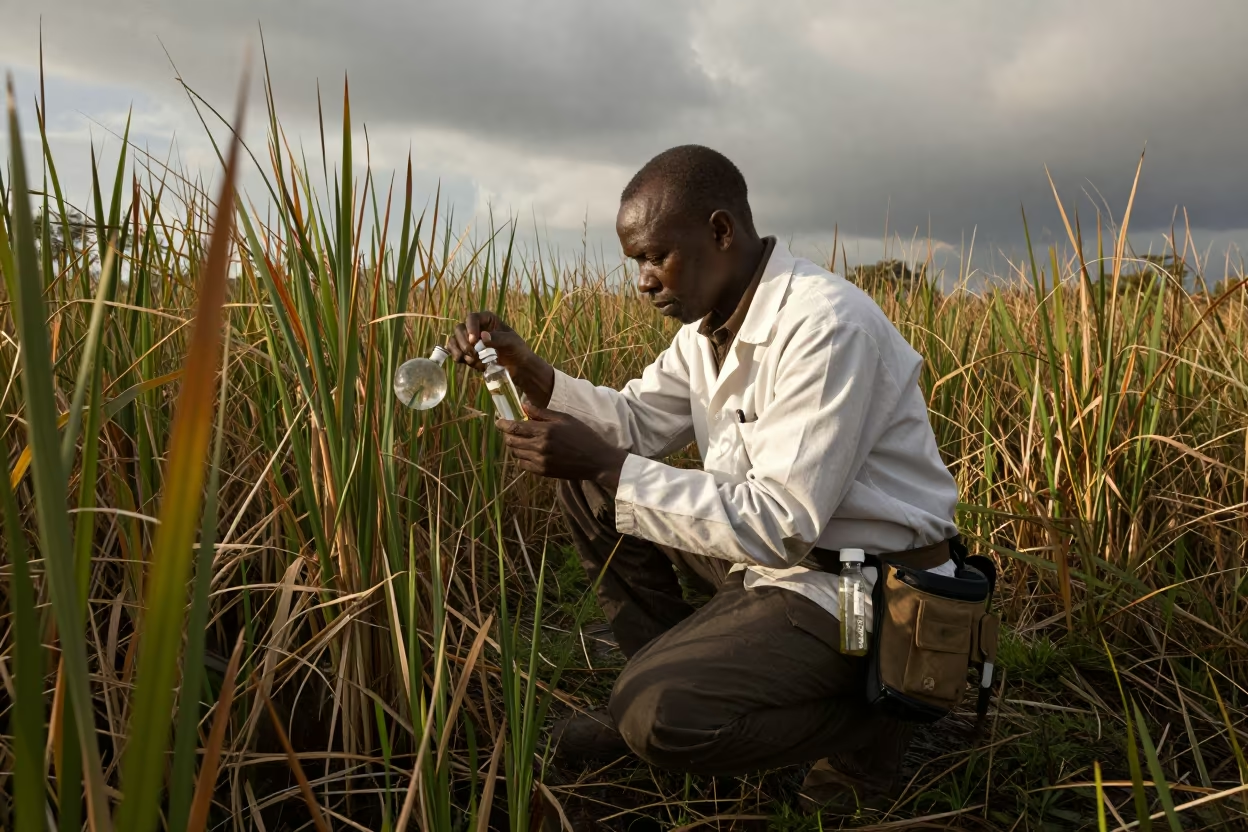
Biologist Crouched In Reeds With Specimen Vials
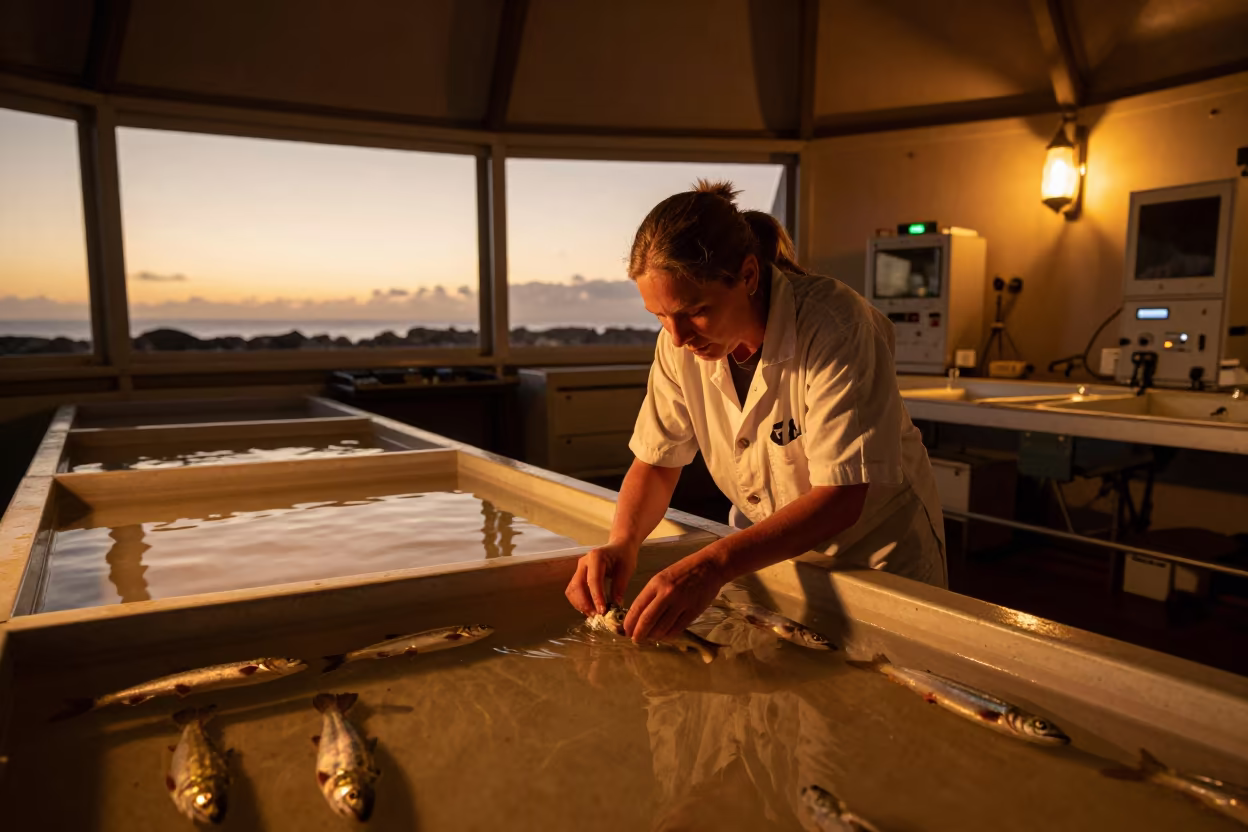
Biologist Measuring Salmon Fry in Galapagos Lab
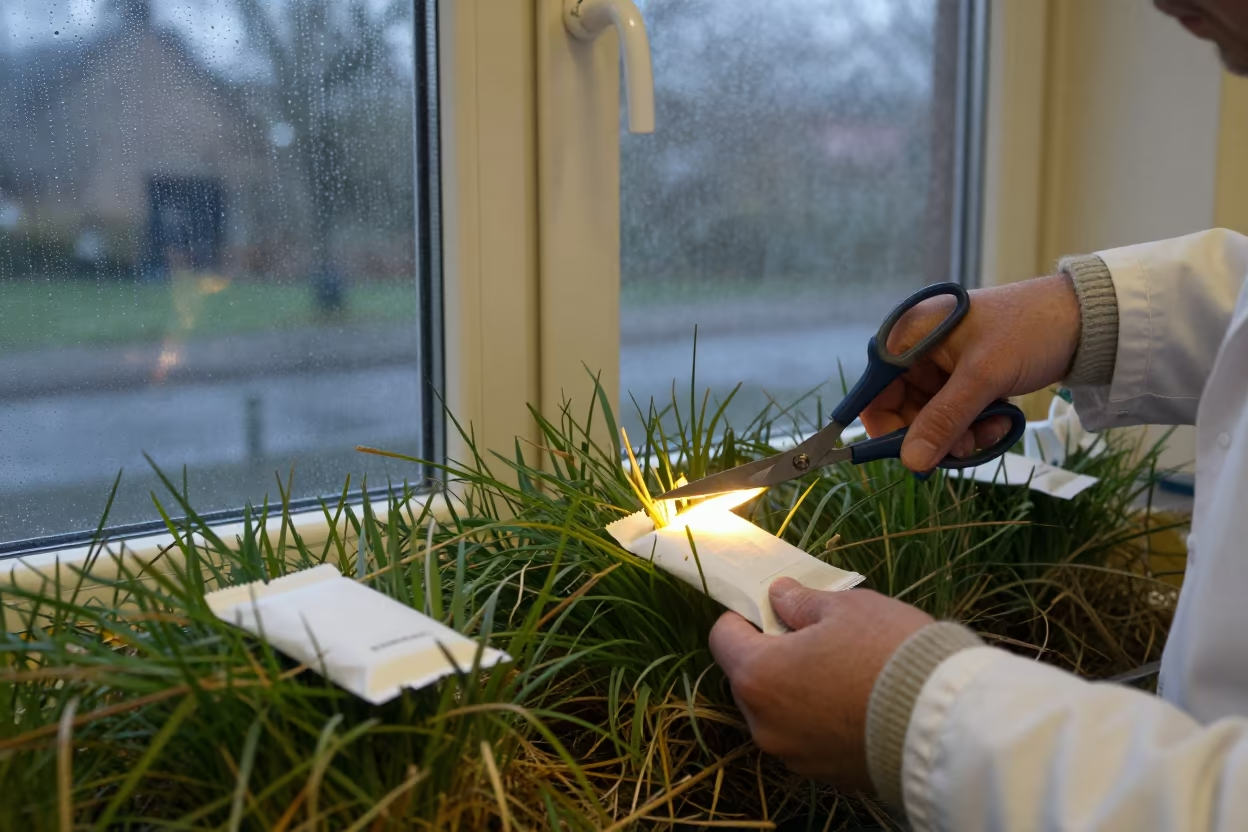
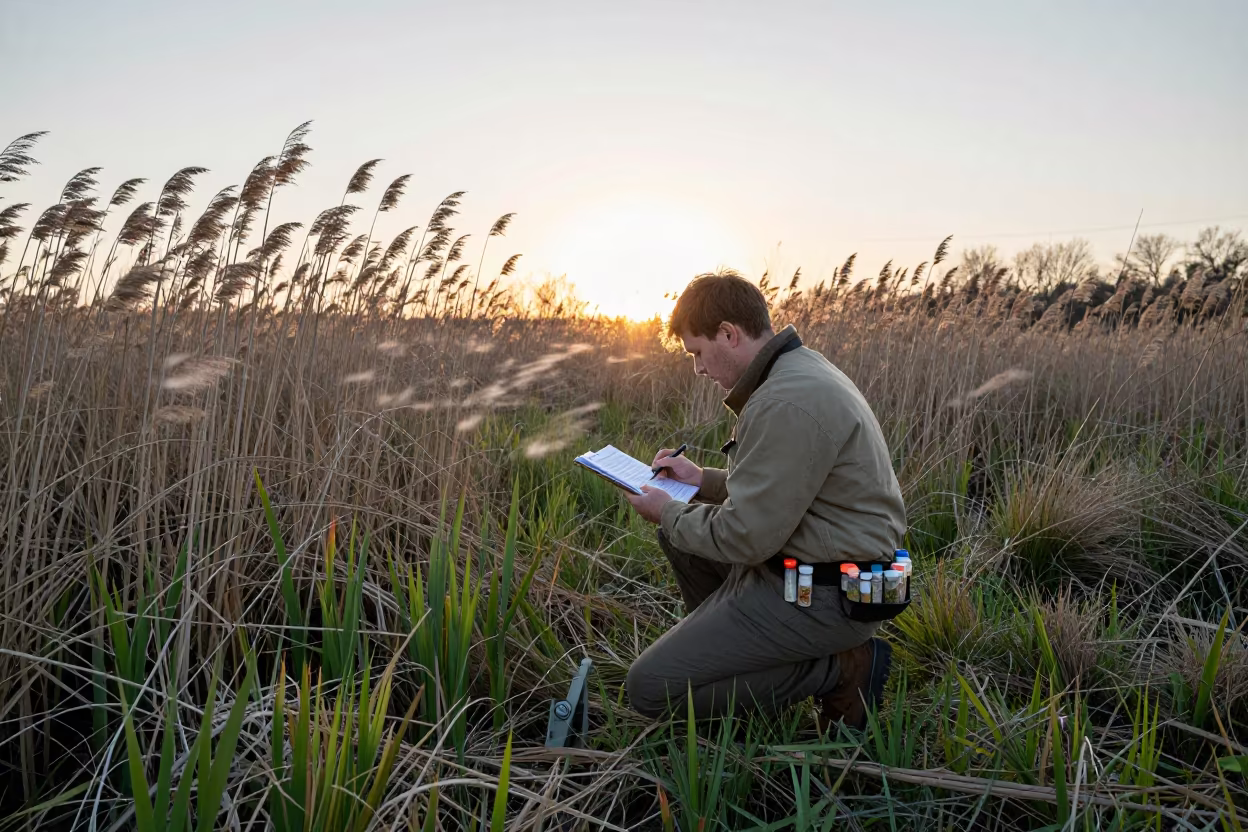
Botanist Collecting Grass in Newcastle Evening
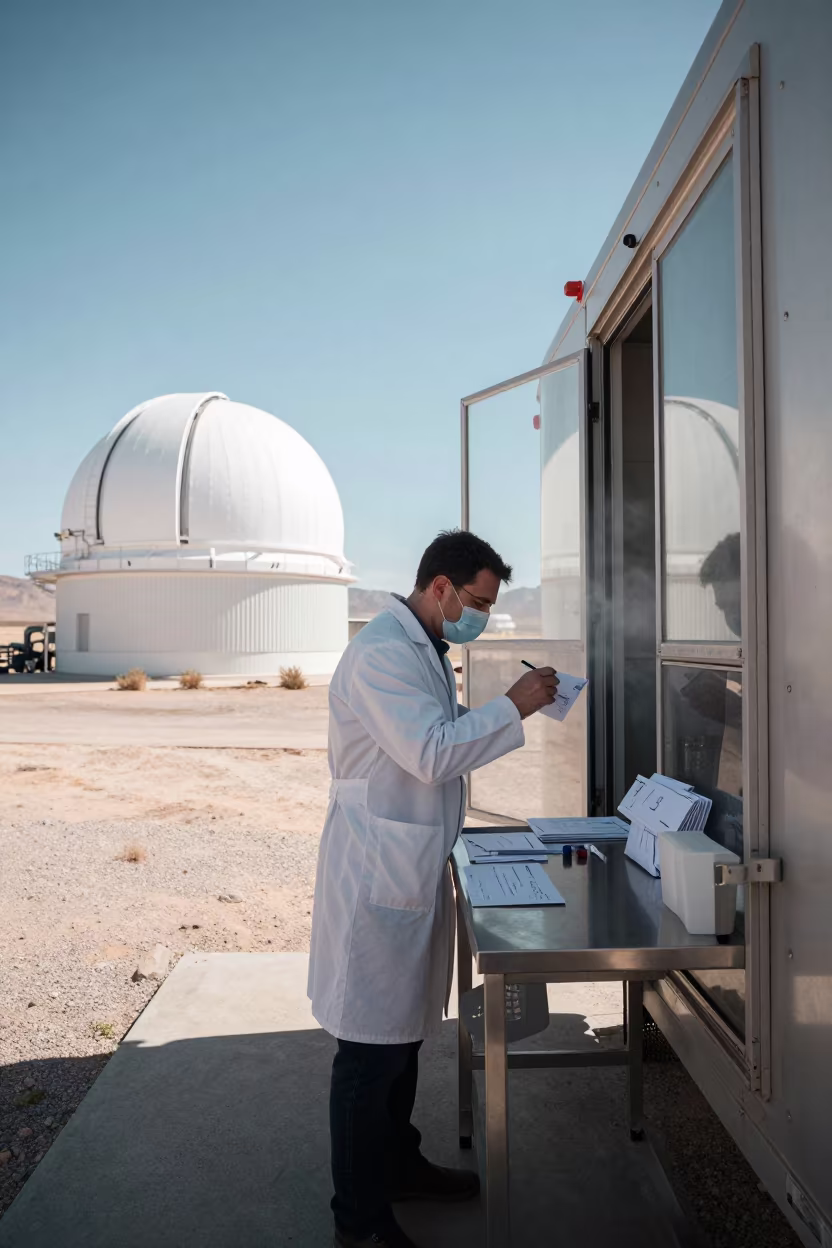
Scientist Labeling Specimens Near Las Vegas Observatory
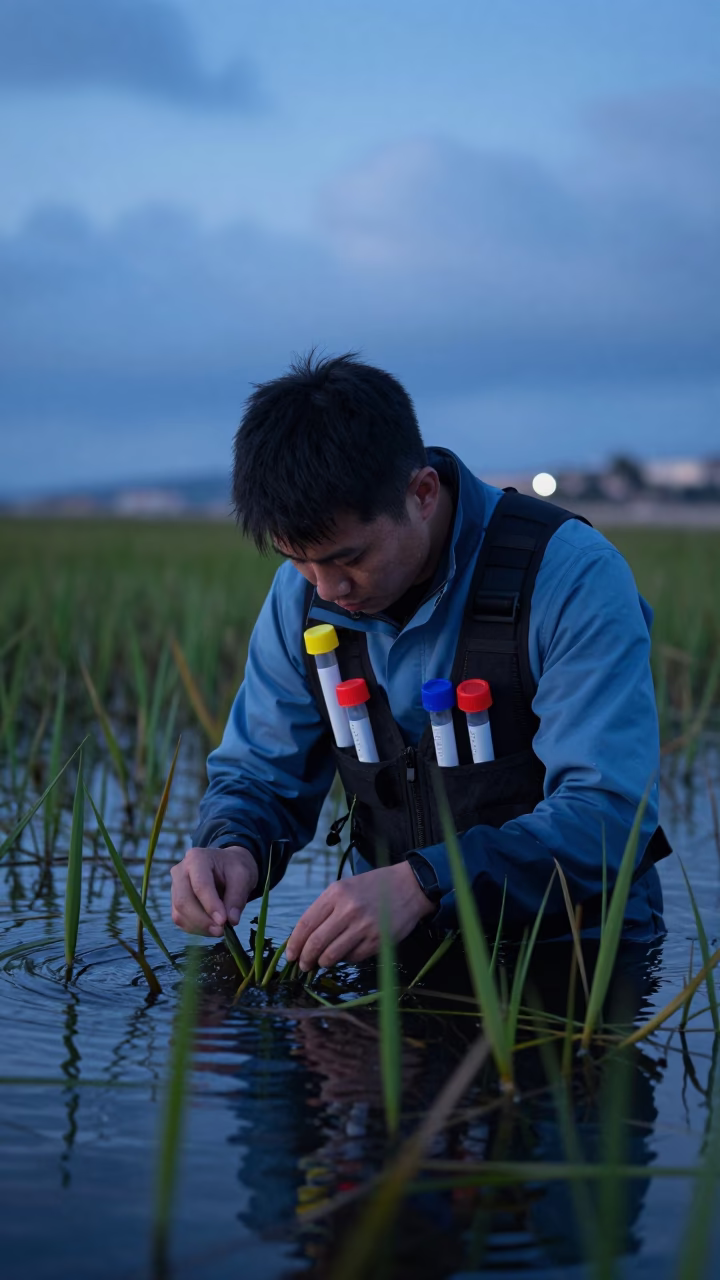
Scientist Wading Through Eelgrass at Blue Hour
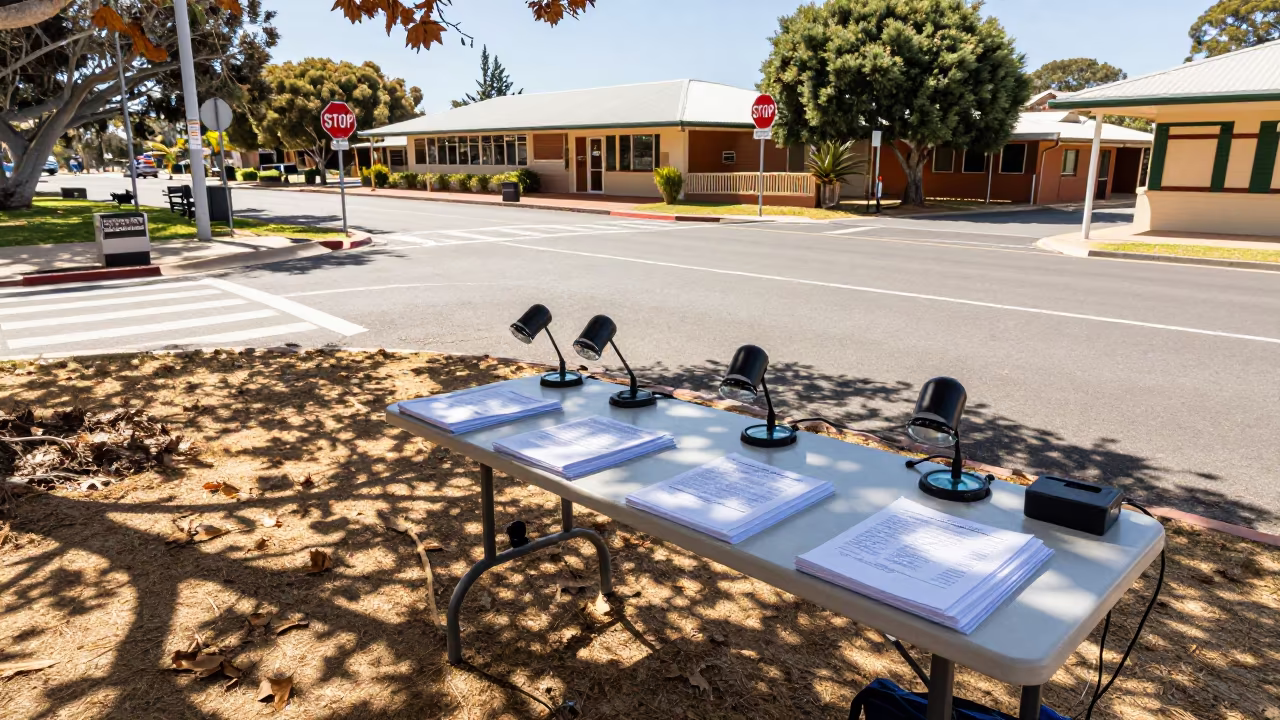
Ballot Adjudication Table at Fremantle School Gate
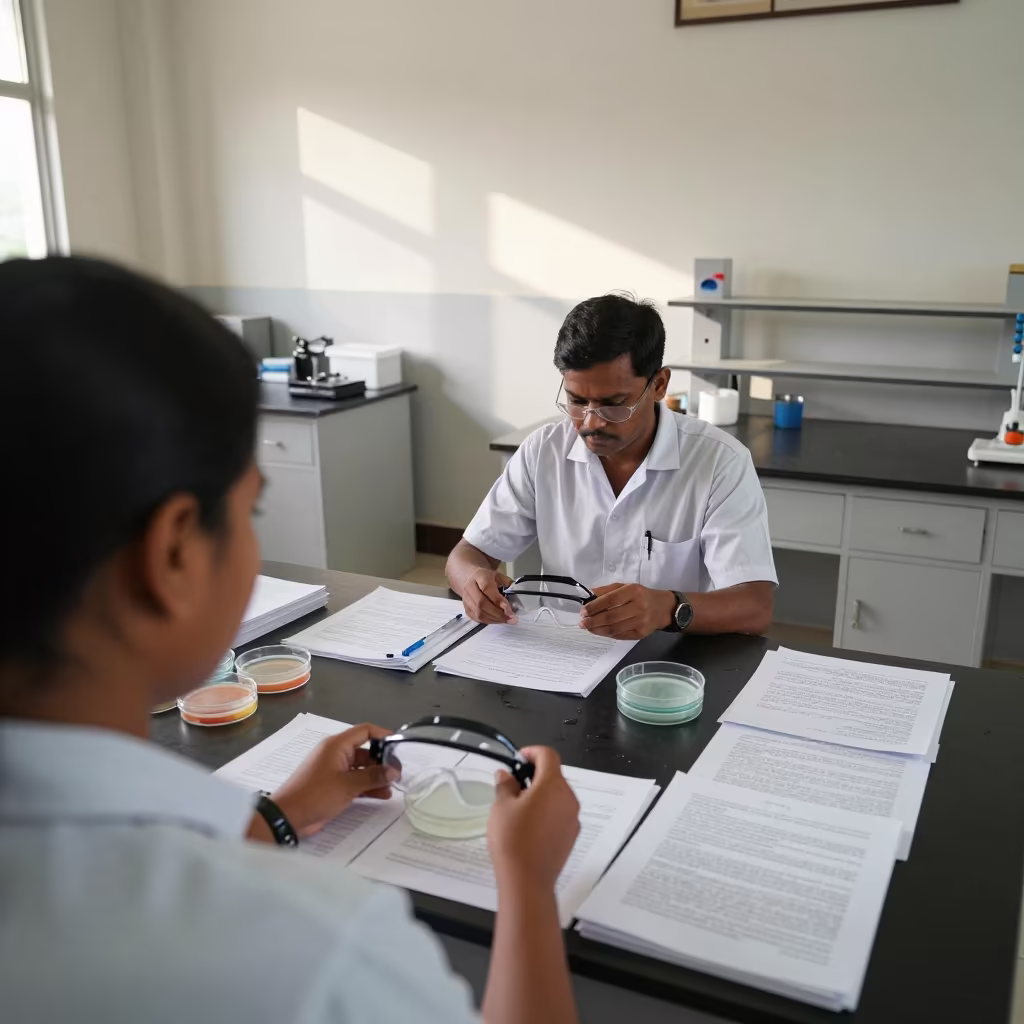
Teacher Sets Goggles and Petri Dishes on Seminar Table
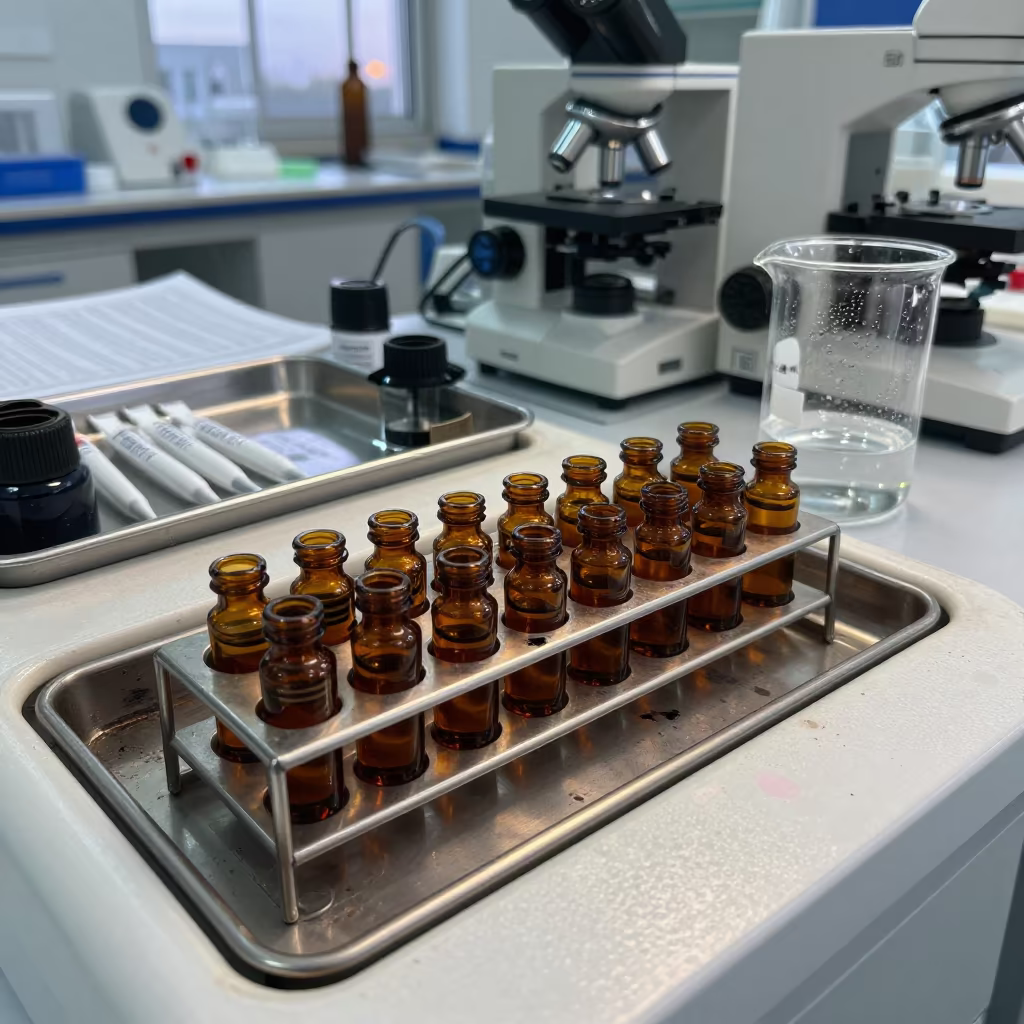
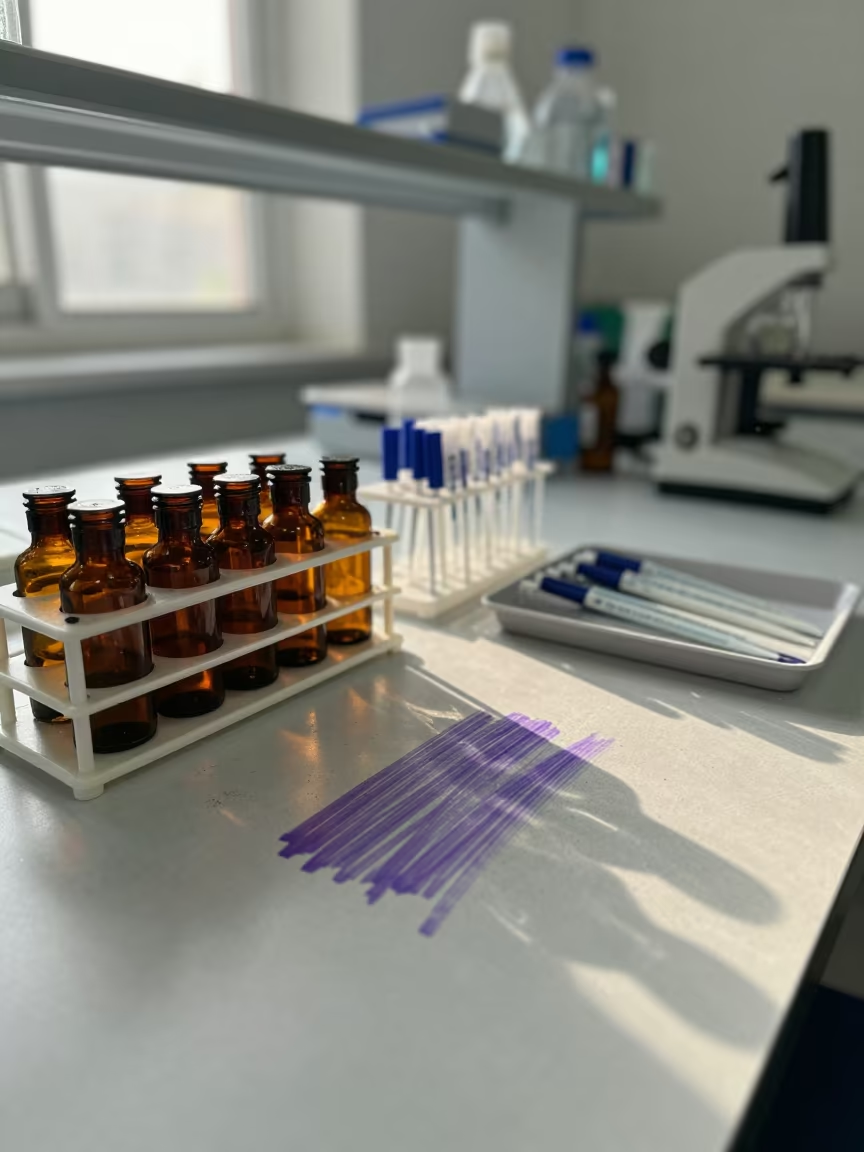
Amber Vials and Pipettes on Science Bench
Chemist Adjusting Burette in Darwin Lab
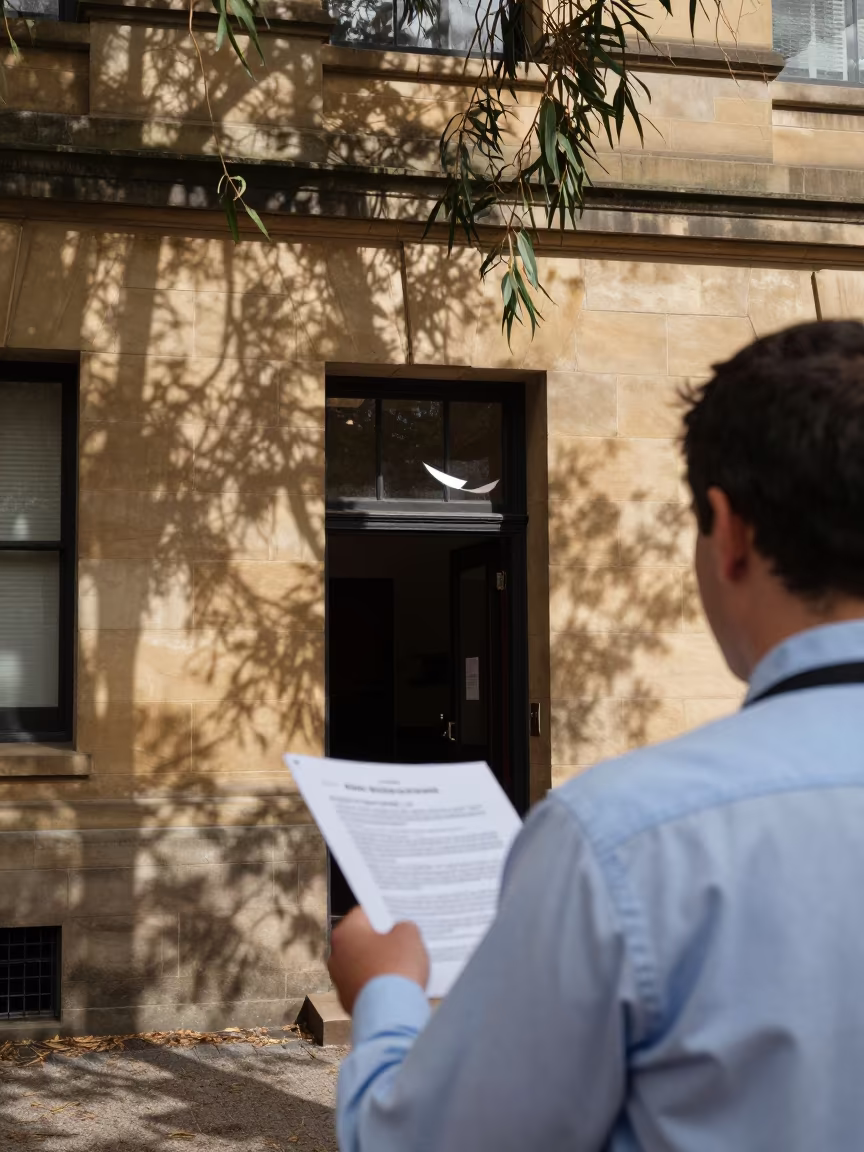
Public Defender in Courthouse Copy Room
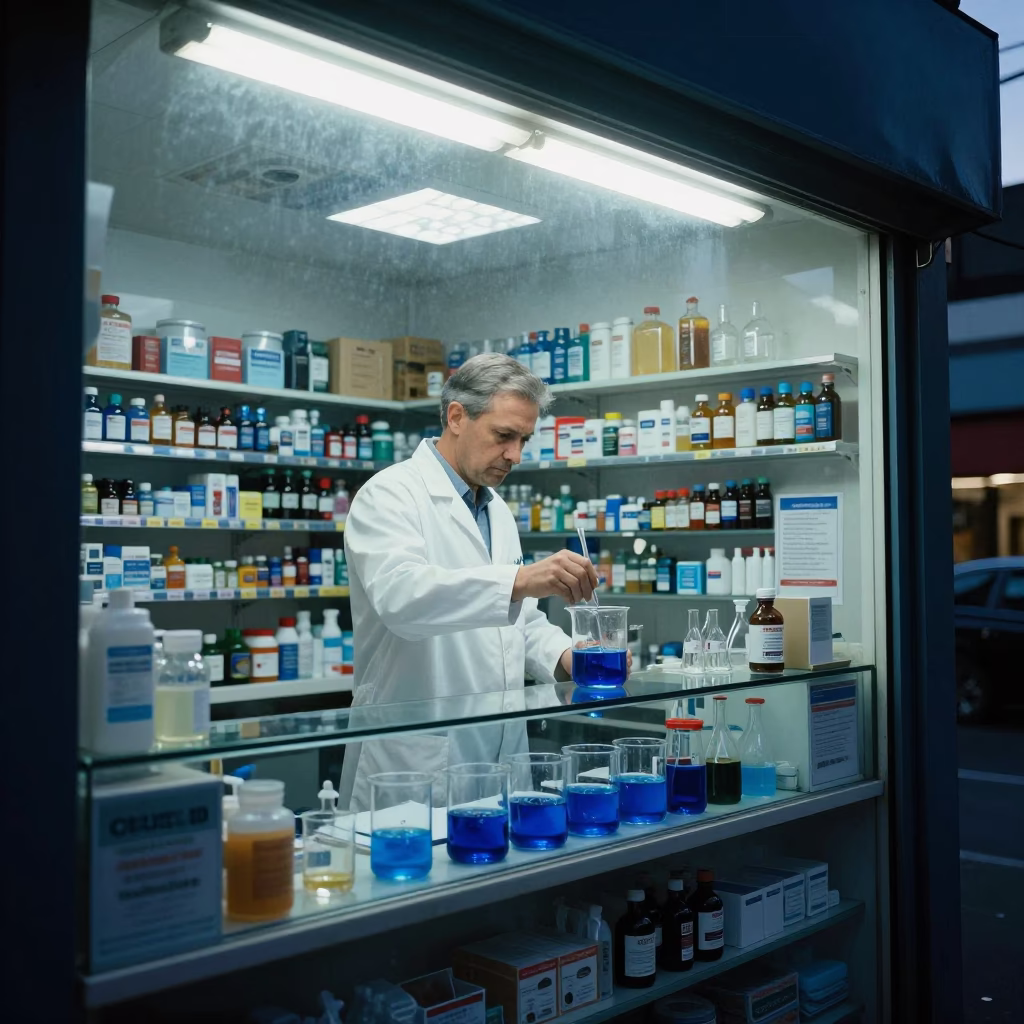
Melbourne Victoria Australia Predawn Street Scene with Chemist and Cobalt Blue Liquid
Biologist in Can Tho Reeds with Vials
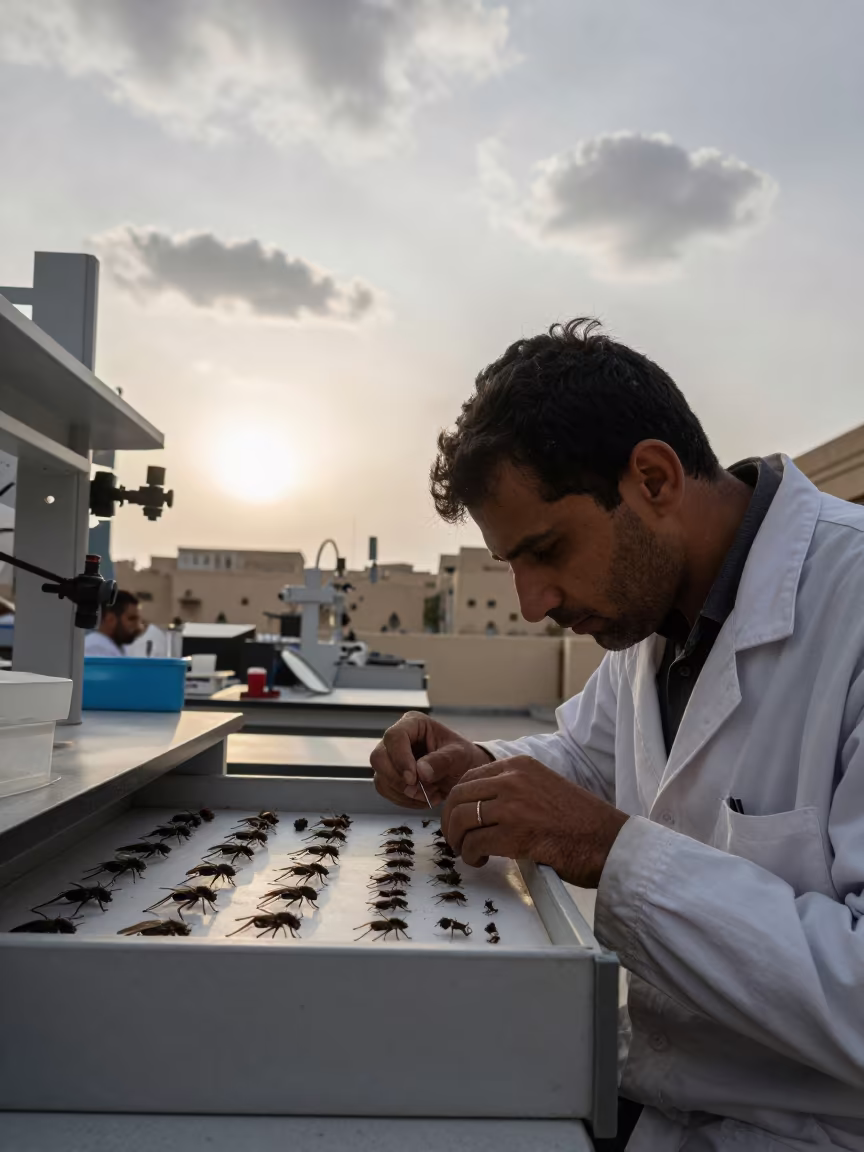
Entomologist Pinning Specimens Under Two Suns
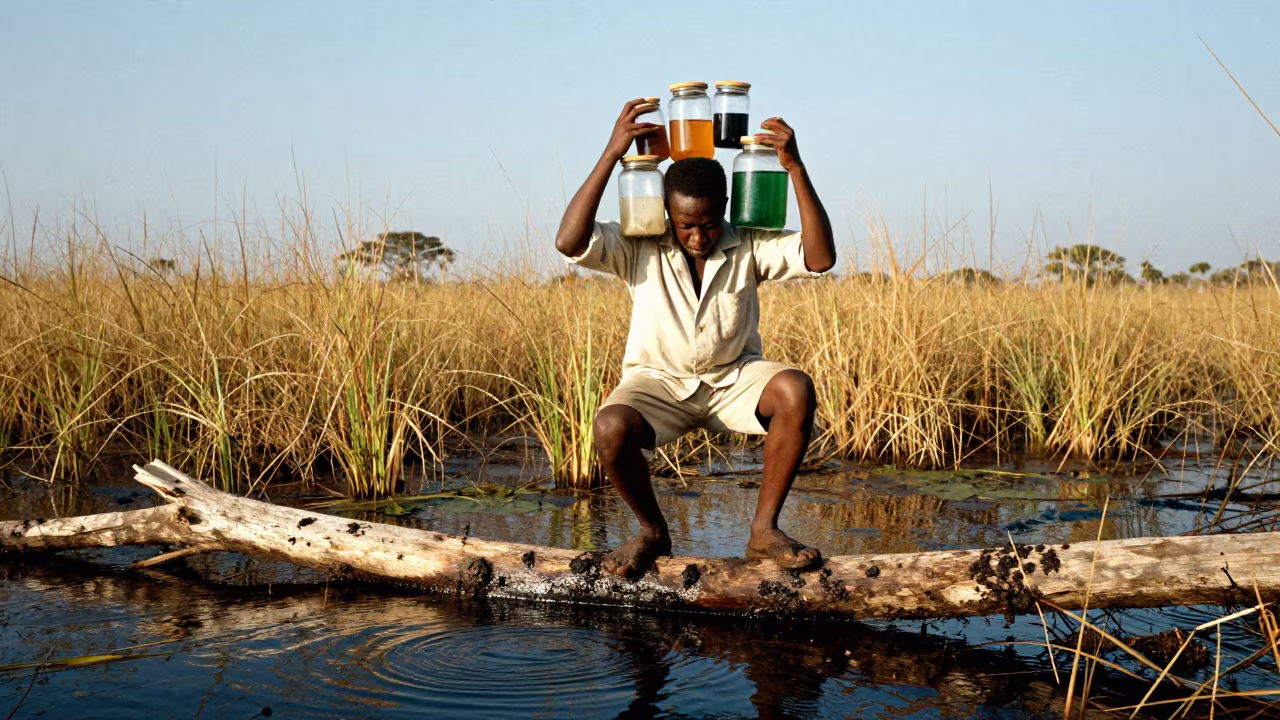
Biologist Balancing on Log with Jars Over Swamp
Botanist Collecting Grass Seeds in Oran Evening
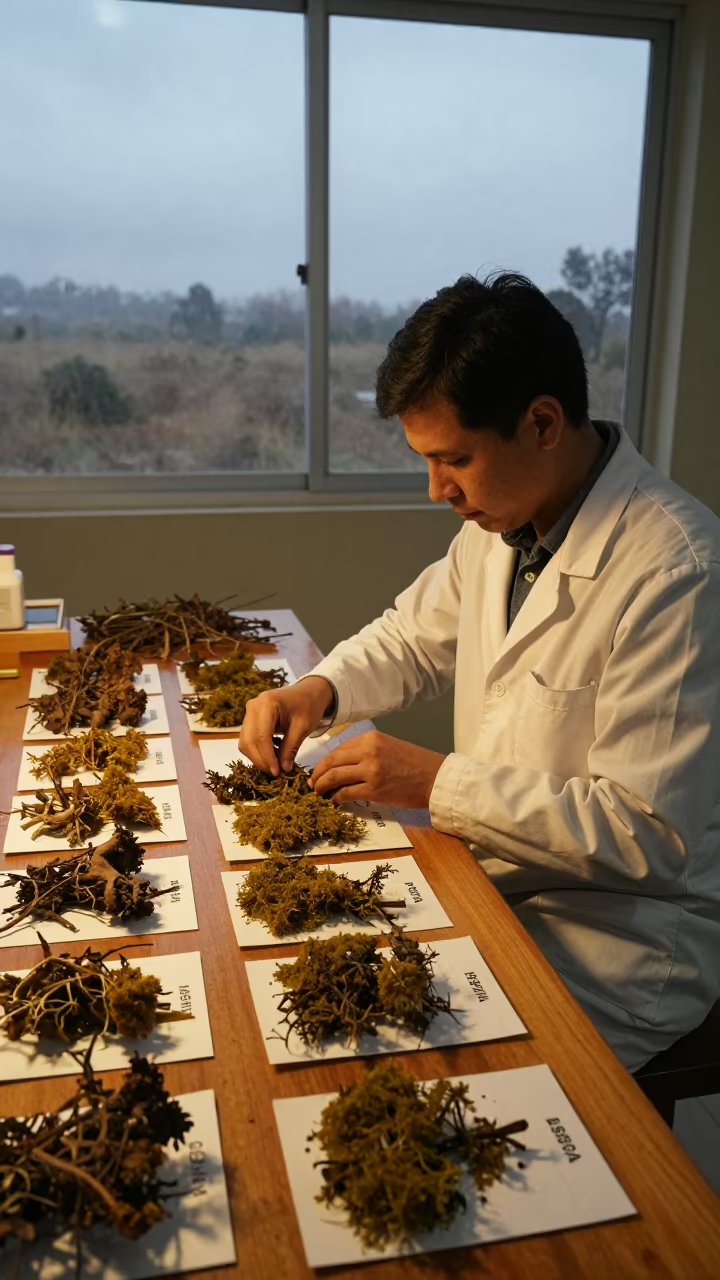
Botanist Spreading Moss Packets in Assela Dawn
Biologist Crouching in Reeds with Vials
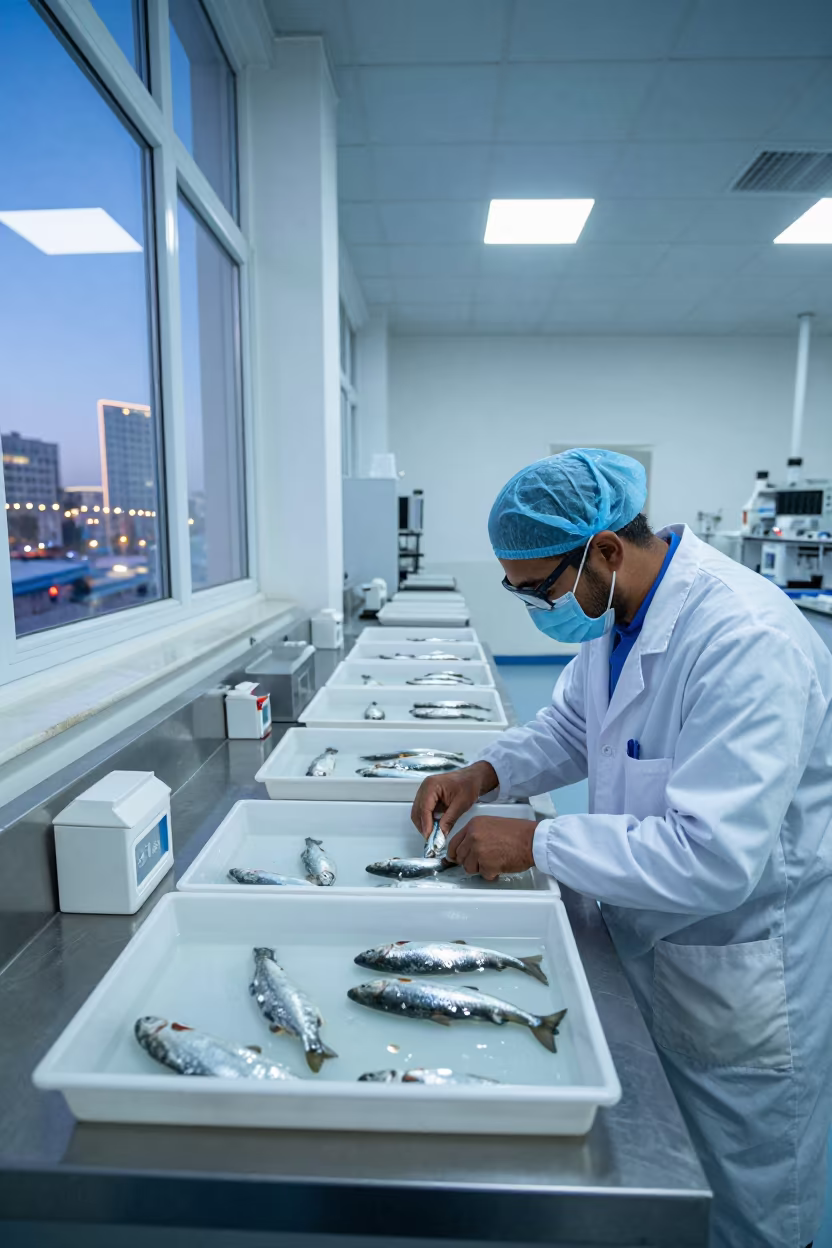
Kuwait Hatchery Biologist Measuring Salmon Fry in Cool Blue Twilight
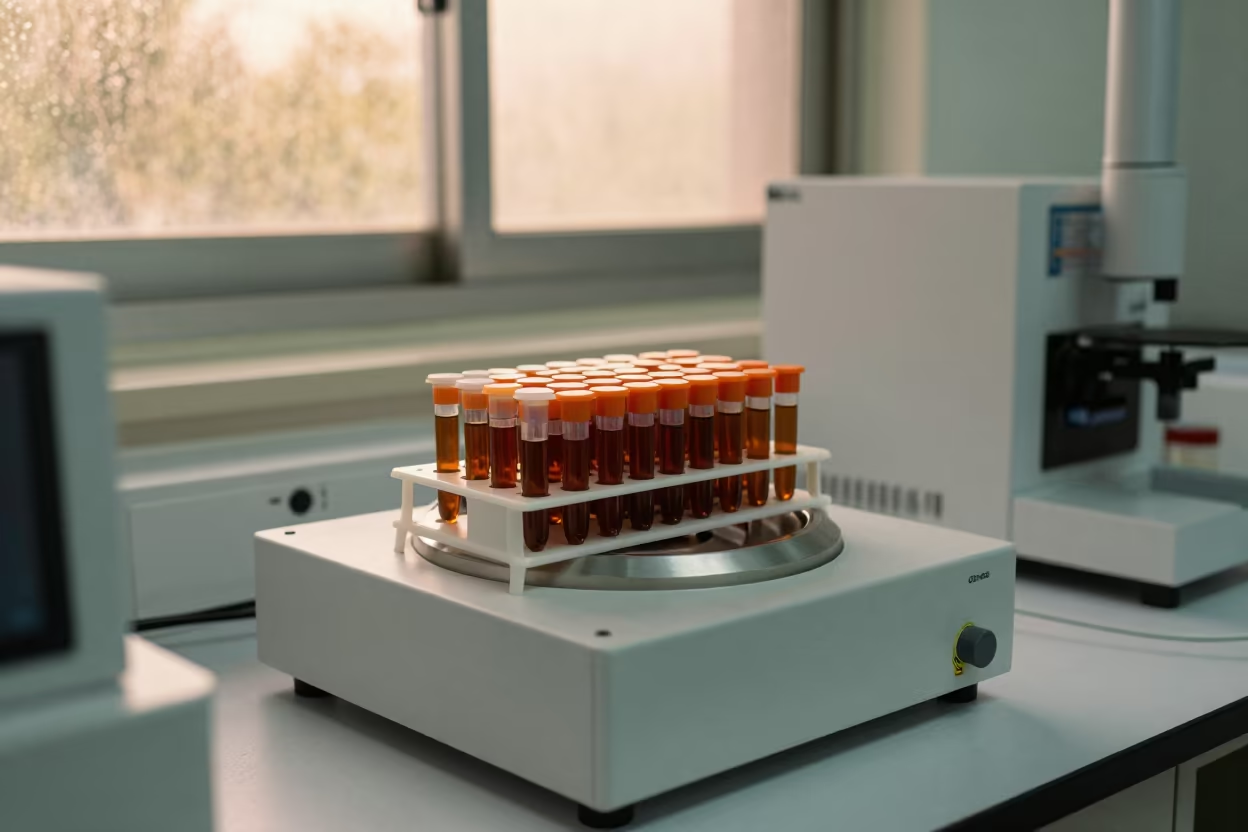
Amber Sample Tubes in Kochi Archive
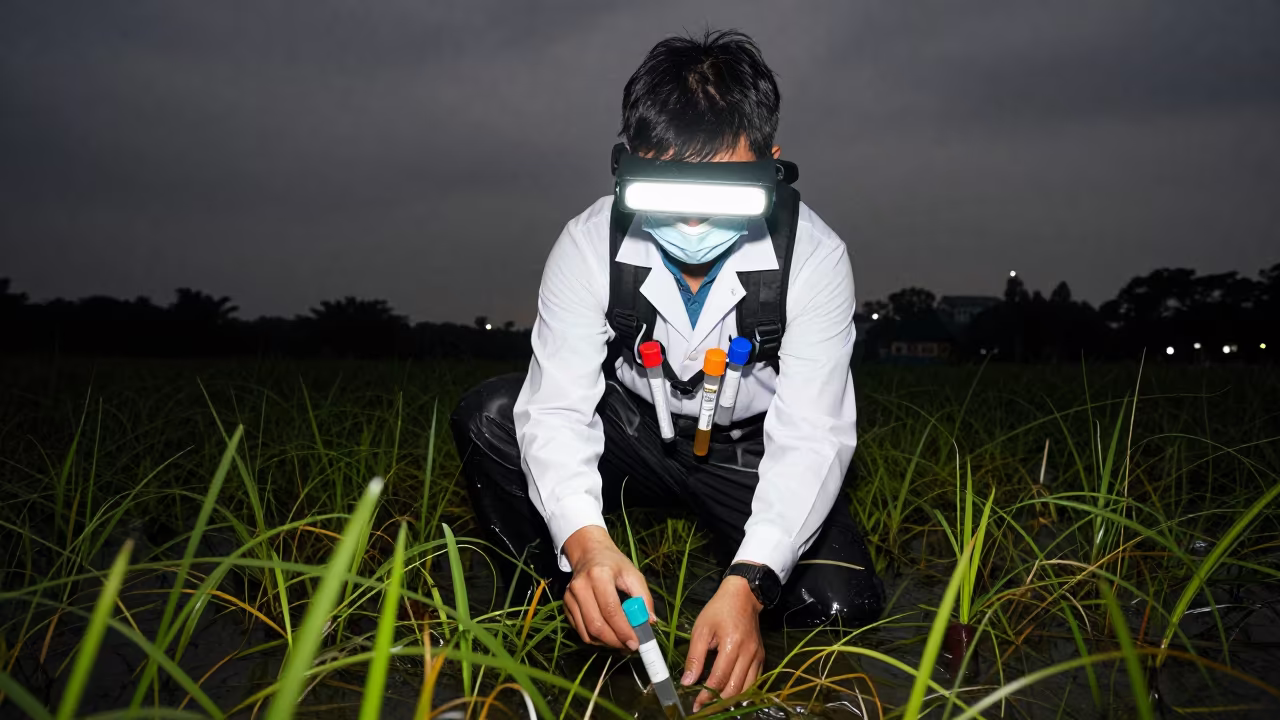
Scientist in Nightlight Eelgrass Sample Collection
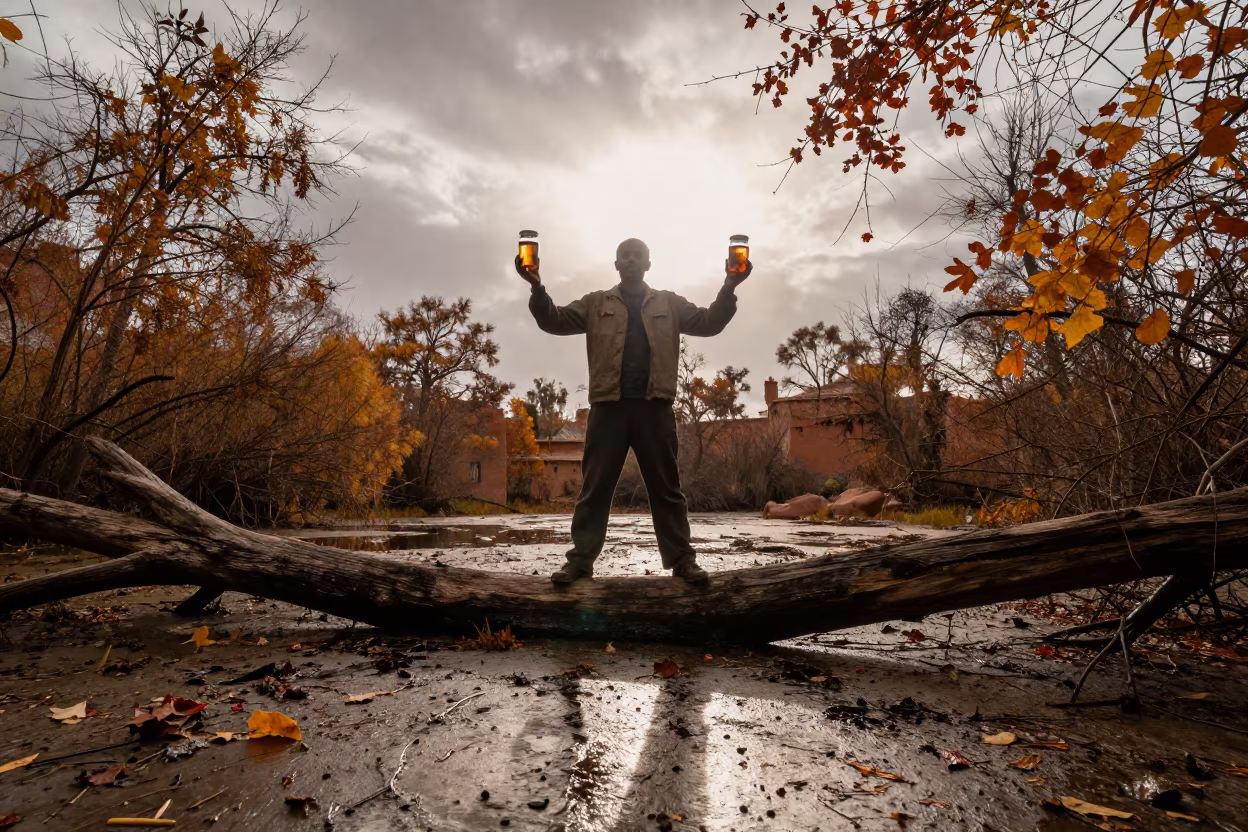
Biologist Balancing on Log Over Autumn Swamp
Scientist Labeling Specimen Jars at Tidal Survey Station
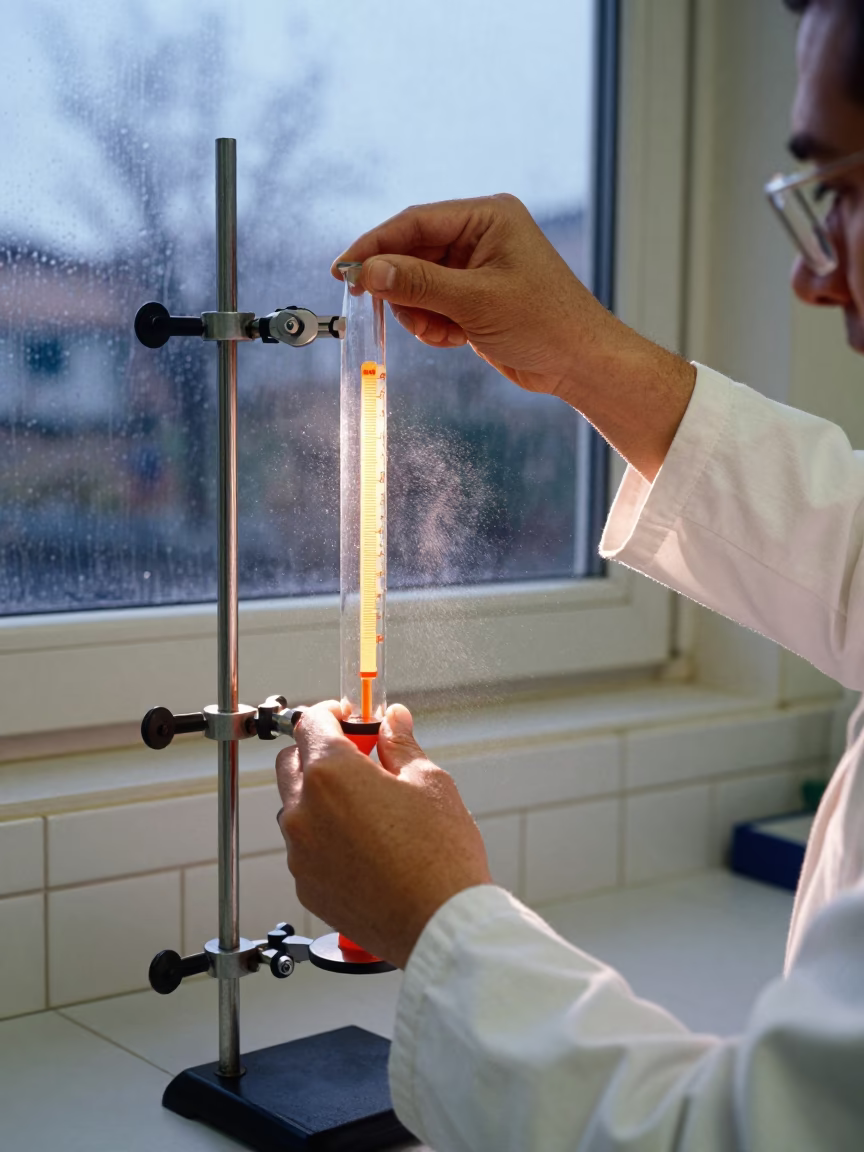
Chemist Adjusting Burette in Alicante Lab
Comments